To read The Daily Call you must be a subscriber (Current members sign in here. ) Start your subscription today.
Author: Willis Bennett
Small Gains
To read The Daily Call you must be a subscriber (Current members sign in here. ) Start your subscription today.
Prices Firm
To read The Daily Call you must be a subscriber (Current members sign in here. ) Start your subscription today.
Expect Additional Tests of Support
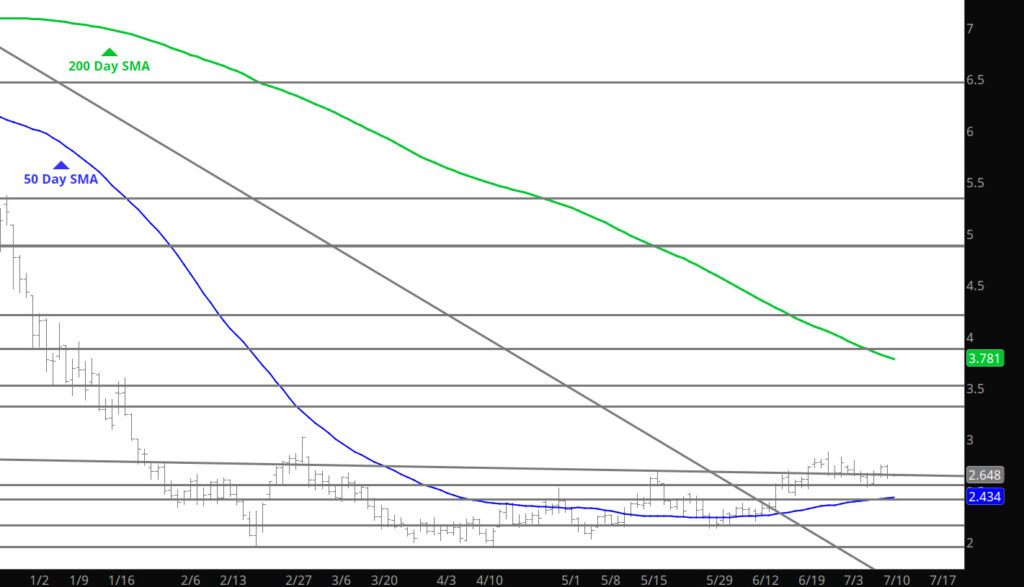
Last week provided the initial test of support and declining in the normal post Independence day fashion– now lets see what the low end of this trading range is as last week provided solid tests of several levels (see Weekly section). The high end of the July range has likely been established with last week’s high– but that is not written in stone.
Major Support: $2.00, $1.991-$1.96, $1.795-$1.766
Minor Support:$2.52-$2.47, $2.38-$2.26, $2.17
Major Resistance $2.816-$2.836, $3.00, $3.536, 3.59
Prices Test Low End of Support
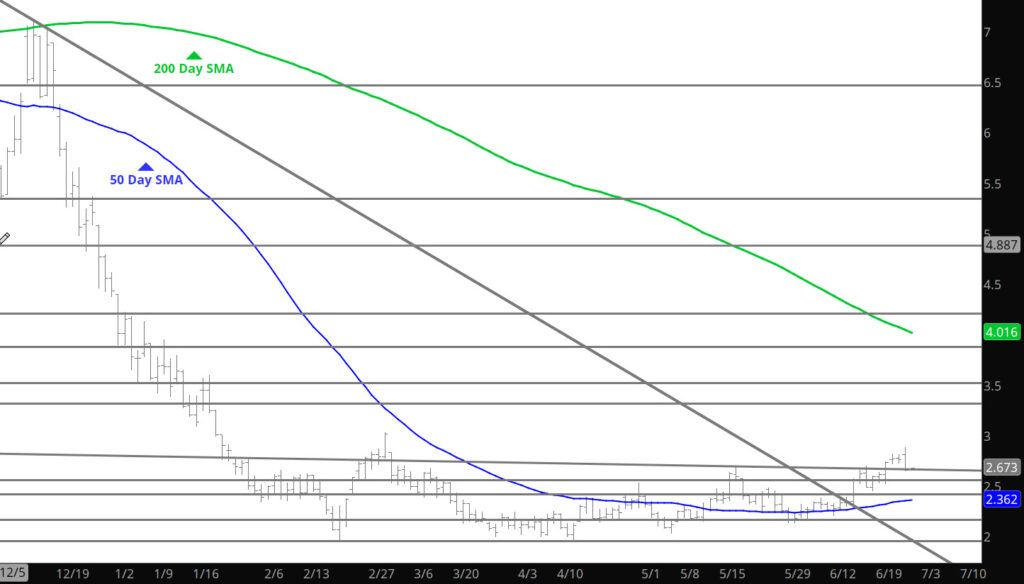
Declines commenced prior to holiday and continued through the week beginning, to test support areas around the $2.52 – $2.57 area. August found support at a variety of moving averages on the continuation charts and its own. On Friday the continuation 20 – day SMA was $2.563, on the August chart the 50 – day was $2.553, the 10 – week, $2.573. Just prior to the close the prompt traded through all those closely watched short – term technical support levels with very low volume (average daily volume this week was +/- 256,000, Friday’s estimate 255,000, about 100,000 contracts less than last week’s average and well below the 30 and 50 – day averages) but managed to recover enough to close above them. In addition, August held above its 06/21 reversal day low ($2.527), but the buying twelve sessions ago that was sufficient to trigger a daily reversal higher was absent . Even with August’s modest week ending recovery the close was below last week’s low, which readers may recall gives rise to a presumption that whether when the market reopens or later in the week, lower trade should be expected.
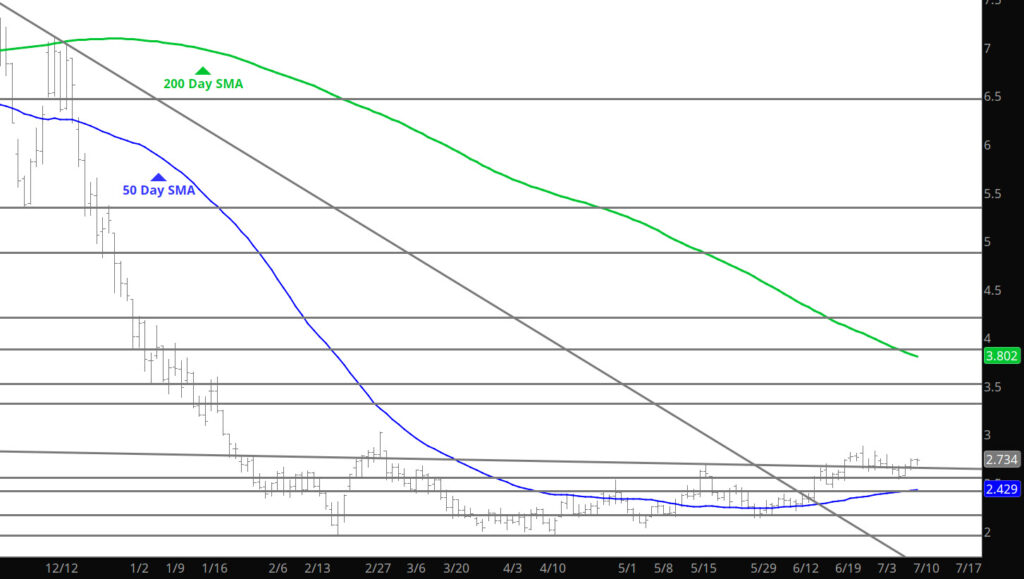
Typically, after a decline from a pre – Independence Day high prompt gas trades to a low during the second or third week of July before rallying. In bull market years the low is often earlier, in bear market years later. Given that neither characterization is currently applicable, prompt gas is, likely, confined in a trading range that began to be defined in late January and that August will spend most of its tenure trading between whatever the post – Independence low turns out to be and the late June high. The low end of the range should become defined this week .
Major Support: $2.00, $1.991-$1.96, $1.795-$1.766
Minor Support:$2.52-$2.47, $2.38-$2.26, $2.17
Major Resistance $2.816-$2.836, $3.00, $3.536, 3.59
Declines Continue Testing Support
Prices declined to test last week’s low at $2.61 but found some buying the big area if the bears want some action is around $2.52 then from $2.52-$2.448. We shall see — volume doesn’t look like it is supporting the declines in a meaningful way.
Major Support: $2.00, $1.991-$1.96, $1.795-$1.766
Minor Support:$2.52-$2.47, $2.38-$2.26, $2.17
Major Resistance $2.816-$2.836, $3.00, $3.536, 3.59
Bears Test the Downside For Now
To read The Daily Call you must be a subscriber (Current members sign in here. ) Start your subscription today.
Early July Trade Has History
To read The Daily Call you must be a subscriber (Current members sign in here. ) Start your subscription today.
A New Month but History Still Working
A note about the charts– having light volume and not working — the charts represent the trade from Monday and Tuesday in the data.
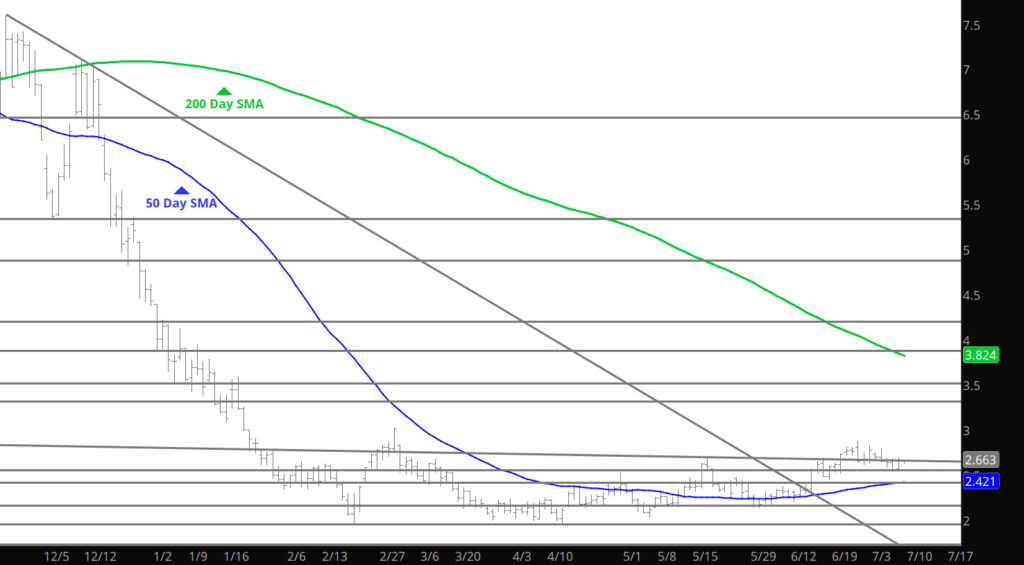
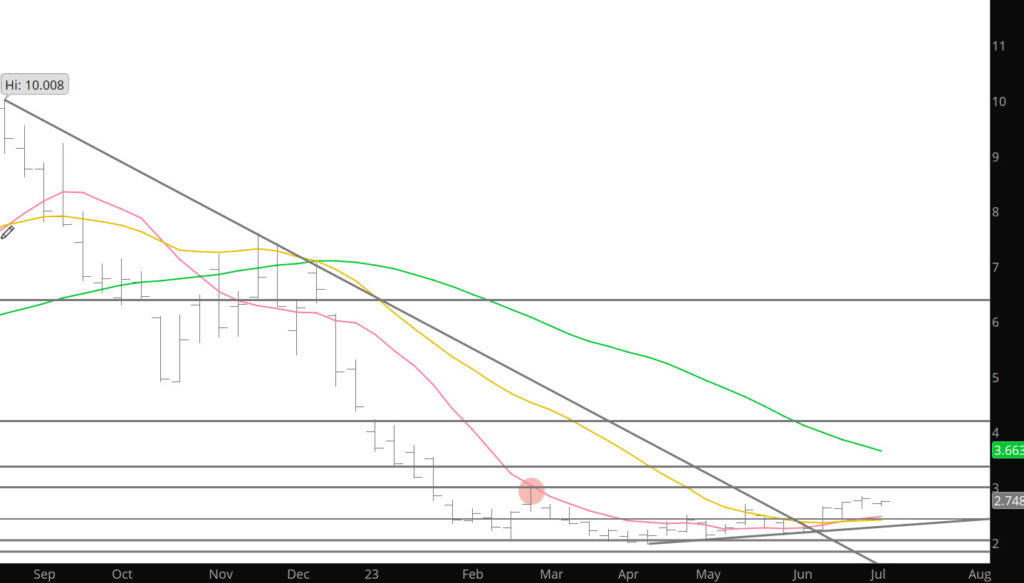
Prompt gas has consistently traded a mid – summer high during the sessions leading into the Independence Day holiday and or just occasionally a day or so after, before declining to a mid – July low. Either expiring July’s trade to $2.839 on 06/28 or new prompt August’s recovery to $2.828 on 06/30 on rather mediocre volume, fit the expectation of pre – holiday high. This does not exclude the possibility that August can’t blow through the June high on the way to test $3 and the March high at $3.027, but I am not convinced that action is coming. The average decline for the Independence Day declining seasonal, over the last ten years is about 13%, the last five years about 16%. Before the pre – holiday rally on Thursday and Friday August had fallen $.32/dt (11%) from its 06/26 high…perhaps early discounting of expected holiday weakness, but seasonal lows prior to the beginning of July have only occurred a couple of times in the last twenty years.
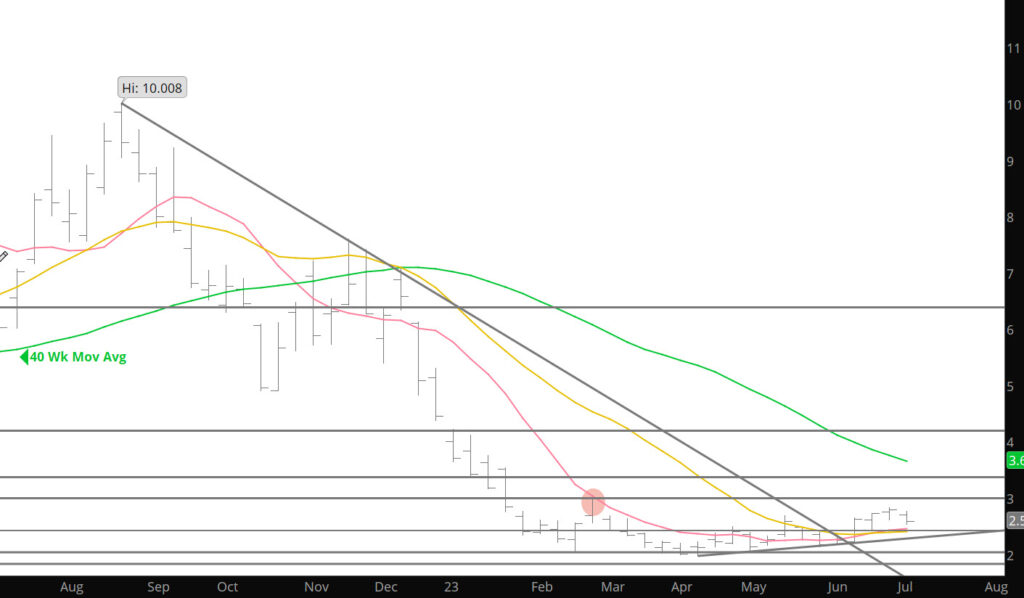
An average decline from the June high suggests a target of $2.40 – $2.50 which also just happens to be the value of a violated declining trend line drawn from the March and highs (currently $2.467 and falling about .03/wk). This was the key break out area discussed a few weeks ago.
You may recall that during late Q1 and early Q2 during the declines and following the March low, several requirements were discussed that if met would strongly suggest that the long downtrend from the August ’22 high was complete. First was that the gas market would need to demonstrate growing sponsorship at a higher low, as discussed here periodically, the April low was higher than March, May higher that April and now June higher than May. Secondly, prompt gas needed to test, trade through and close above the trend line drawn from the August – November – December highs (discussed here as the break out area). During week ending 06/09 prompt gas traded an extraordinarily narrow range while testing that declining resistance AND support rising from the April – May lows. The following week prompt July traded through the downtrend defining trend line, closed above it and did so with a substantial increase in volume. Third, the prompt had to follow through to the upside with declining open interest, indicating that institutions with a substantial short position were throwing in the towel. Since the close of June 6th ($2.262) through the close of June 27th ($2.763) the total number of contracts outstanding fell 157,853 contracts. That’s a lot and certainly qualifies as short covering pure and simple. The last requirement,and one that would suggest a new uptrend is beginning), is that volume and open interest increase along with price. Don’t expect that one for a while because prompt gas remains in a trading range that has confined successive prompt contracts since late January remember, just because the requirements for the end of a long – term down trend have been met does not mean that something similar to the upside has begun. Expectations are that there will be multiple short – term uptrends and downtrends within the confines of that trading range during Q3. The gas market is in a state of flux between a substantial group of participants that believe gas prices will be low forever (they speak about over supply and storage surpluses) and others like this analyst that comment that would be tooo easy. Take a look at the monthly chart of August gas (below). We have previously discussed that “outside” months are rare. There were a couple last summer and another one in March but can’t find any other period over the entire history of natural gas trading where there were three within a nine month period. It is not a coincidence that extreme volatility occurs near turning points. The chart below shows that of the last four months, trade during three of them has been through both the prior month’s extremes. That illustrates uncertainty on steroids.
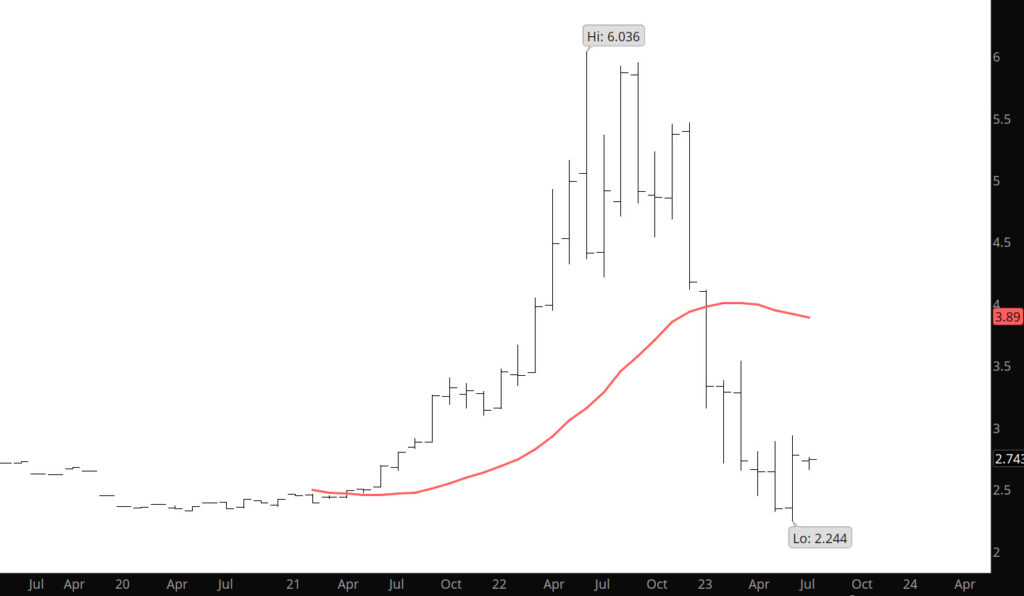
Not suggesting that prices are headed back to $10 in the near term, but the down trend that has held the market since last fall seems to be slowly correcting its bias.
Major Support: $2.00, $1.991-$1.96, $1.795-$1.766
Minor Support:$2.47, $2.38-$2.26, $2.17
Major Resistance $2.816-$2.836, $3.00, $3.536, 3.59
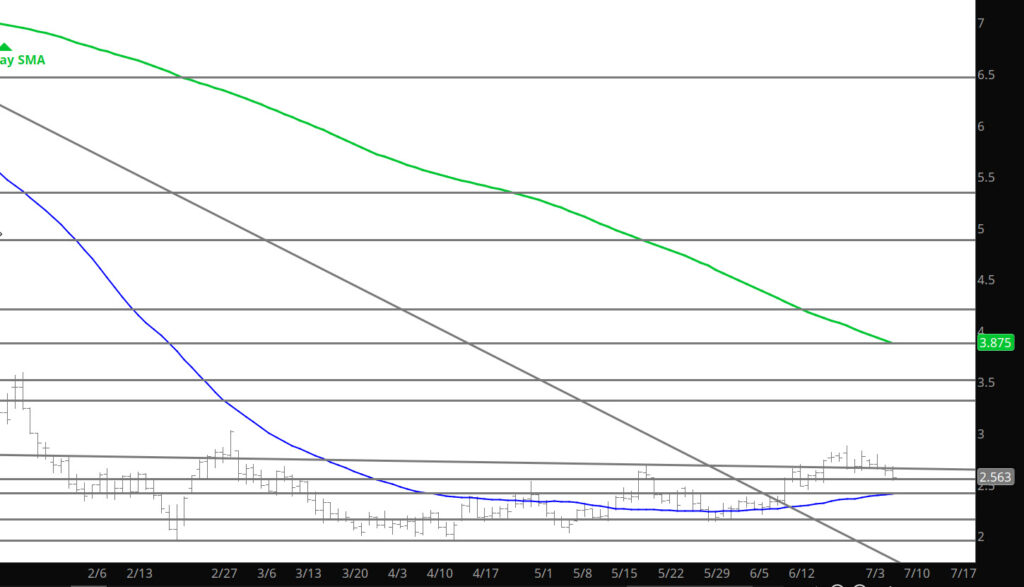
Quiet Start to the Trade
Not much to say about the trade yesterday except that the number forced some shorts to cover– set the high for the day and then wallowed around on light volume. Light volume not surprising going into the holiday week. Looks like folks in the northeast are having troubles leaving for the holiday and judging from the trade — some may be nat gas traders. Speaking of leaving — I will not be providing a Daily on Monday and the next Daily will be on the 5th of July– have a great Independence celebration with your families.
Major Support: $2.00, $1.991-$1.96, $1.795-$1.766
Minor Support:$2.47, $2.38-$2.26, $2.17
Major Resistance $2.816-$2.836, $3.00, $3.536, 3.59