To read The Daily Call you must be a subscriber (Current members sign in here. ) Start your subscription today.
Author: Willis Bennett
Break Out Upon Us
To read The Daily Call you must be a subscriber (Current members sign in here. ) Start your subscription today.
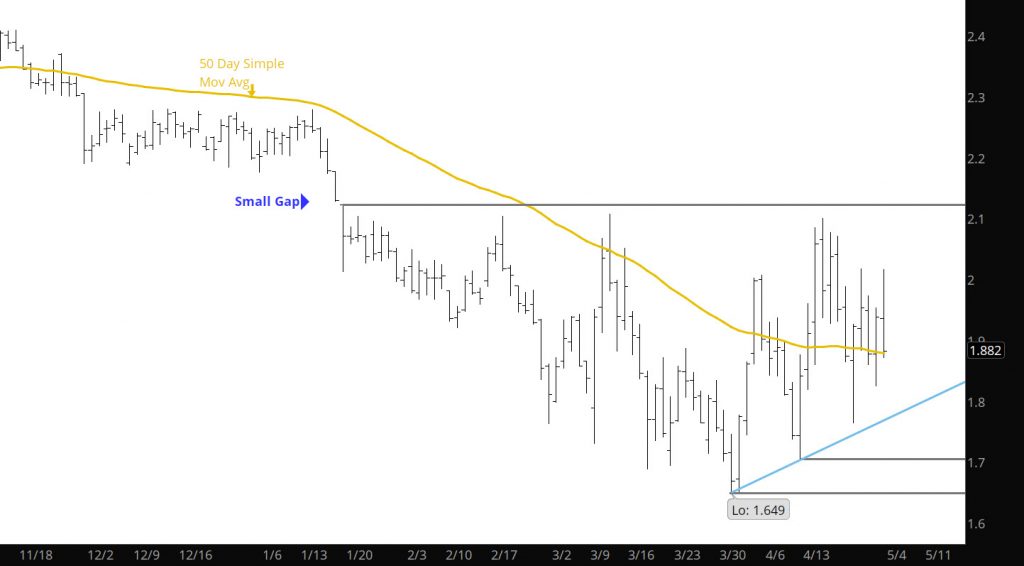
Higher Lows — Constructive
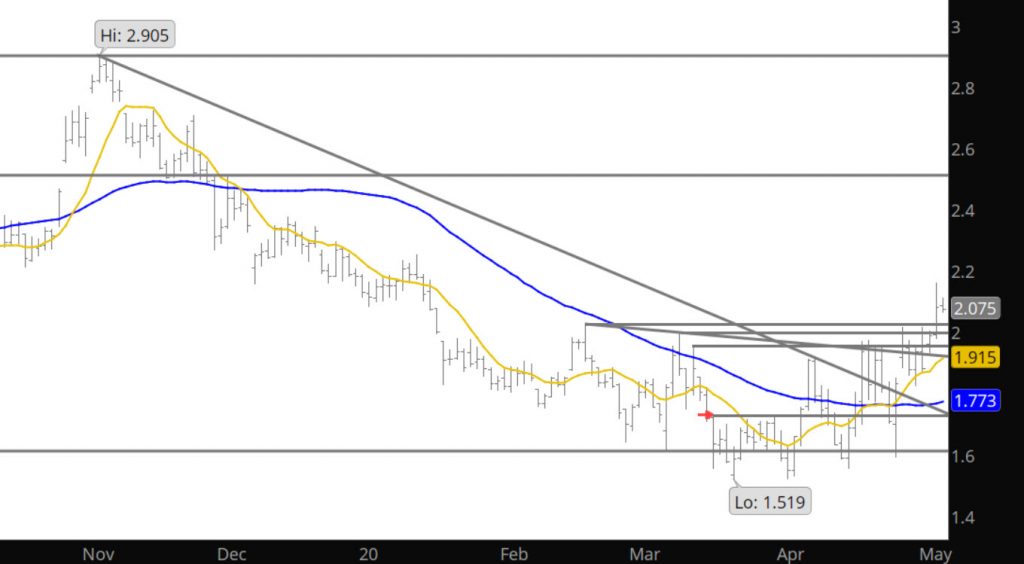
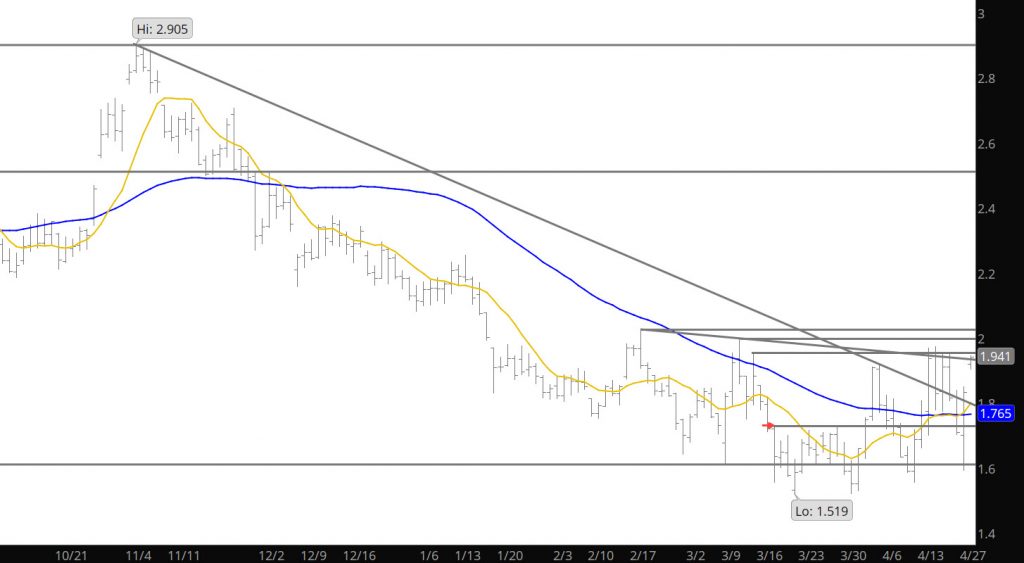
Last week continued the process of developing a consolidation process that will either lead the market to a break out (above the $2.029) area or a failure and a break below the key support area that has held prices for two months and four tests. An interesting note on trading, for the last three months, failure at the key resistance ($2.029) or near it resulted in an immediate test of support (within two weeks) as traders were content in working the range. Last week, prices could only manage a slight decline to $1.59 in the light trade around May expiration, before making another run at resistance. This action has now set the constructive behavior of higher weekly lows and another higher weekly close. Some of this behavior is clearly linked to the $.10 premium that June was awarded on expiration.
It you are bullish one of the concerns for you to overcome is the lack of volume last week. Markets successful in making a bias change usually occur with a volume break out in the direction of the upcoming bias shift. The continued strength in the differed contracts offsets this concerning issue and suggests the bullish argument more of “when” rather than “if”.
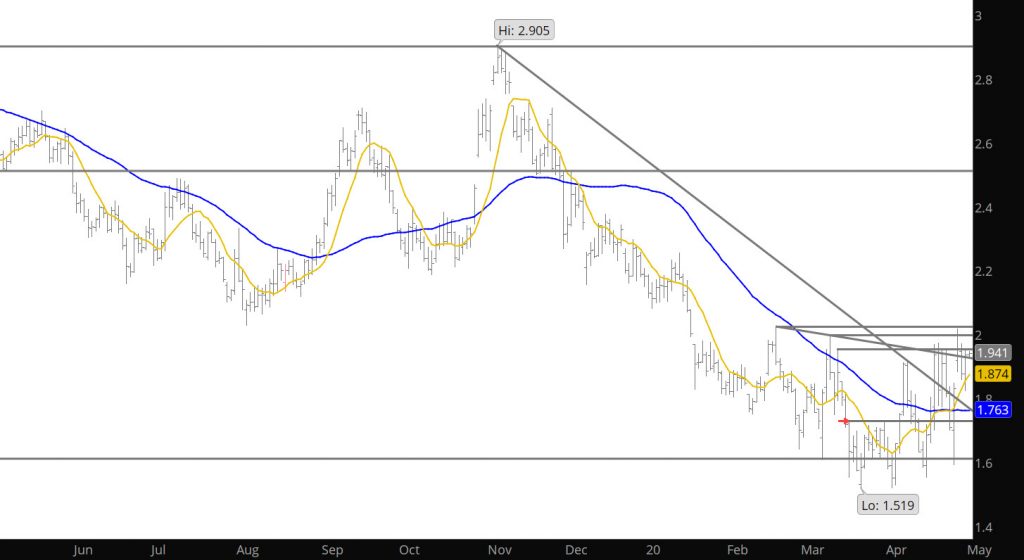
Calendar April ended as an “inside month” which is the first time that the trade range in April has remained inside he extremes provided during March since 1996. The high for the week was early on Friday morning, May 1st. Technical theory has suggests that and “inside” trade with falling volume (discussed above) and closing the month near the highs of previous period ($.03 shy of March high) is constructive for the intermediate term. Think of it as the sponsorship need to drive prices though the previous month’s extreme was lacking but closing near the highs — the balance of power was shifting.
Major Support: $1.611, $1.555-$1.519
Minor Support: $1.794, $1.78-$1.765
Major Resistance: $1.993-$2.025, $2.062,$2.08-$2.102
Minor Resistance: $1.968
Higher Weekly Close

To read The Daily Call you must be a subscriber (Current members sign in here. ) Start your subscription today.
Prices Rebound and Look to Test Resistance
To read The Daily Call you must be a subscriber (Current members sign in here. ) Start your subscription today.
Shocking –Weakness on First Day
Expiration Within Expectations
Just a reminder — this will be the last week that the Daily will arrive in your email unless you subscribe to the website. Effective May 1, you will have to subscribe to the website to receive the Daily. This market seems to be forming a bias change and ecomenergy will be leading the analysis during the transition.
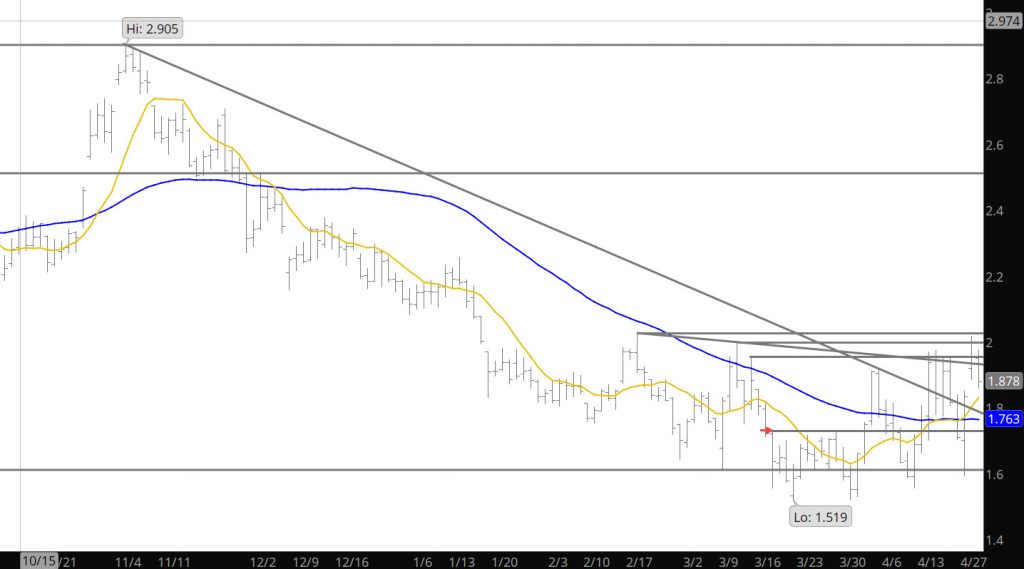
The May contract expired at the high end of my expectations discussed on Monday ($1.61-$1.833) at $1.794. This was after two days of $.22 and $.25 daily ranges — whats that all about. My thoughts were that prices in June prompt would try to close with May’s prices but it is at the high end of the range that has held resistance for an extended period of time. Perhaps prices will collapse down into the support zone from May and April, or as the differed price action has indicated, future strength will control the market. The expiration of May at the high end and the strong differential to June needs to be addressed near term.
Major Support: $1.611, $1.555-$1.519
Minor Support: $1.78-$1.765
Major Resistance: $1.993-$2.025, $2.062,$2.08-$2.102
Minor Resistance: $1.968
Interesting Options Expiration
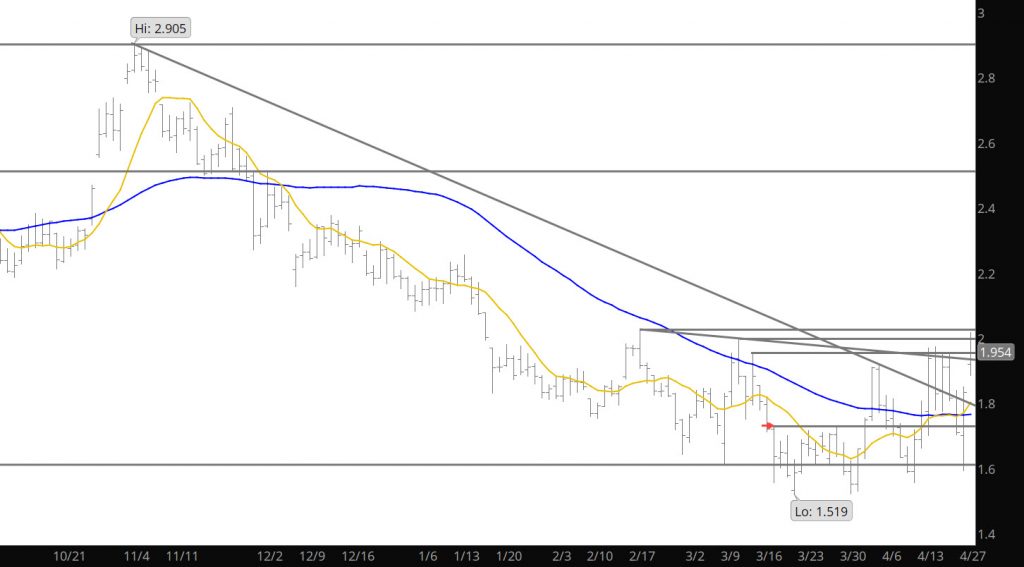
When I wrote yesterday’s Daily Call I did not expect the range for expiration of the May contract to be the range of day before expiration (options expiration). Noticing the trade early in the day, I was startled with the severity of the declines and the potential for expiration below that of April’s expiration. A cup of coffee later, the market rebounded a dime and continued the rally to the high side of my aforementioned expiration range. Currently, there is little insight as to how and where expiration occurs. The May contract has traded only a dime discount to the June contract which represents a significant reduction in the spread. As a trader, I will take a step back to watch for the expiration today, referring back to a series of comments over the last couple of weeks regarding the importance of this expiration.
Major Support: $1.611, $1.555-$1.519
Minor Support: $1.78-$1.765
Major Resistance: $1.993-$2.025, $2.062,$2.08-$2.102
Minor Resistance: $1.968
Going Forward
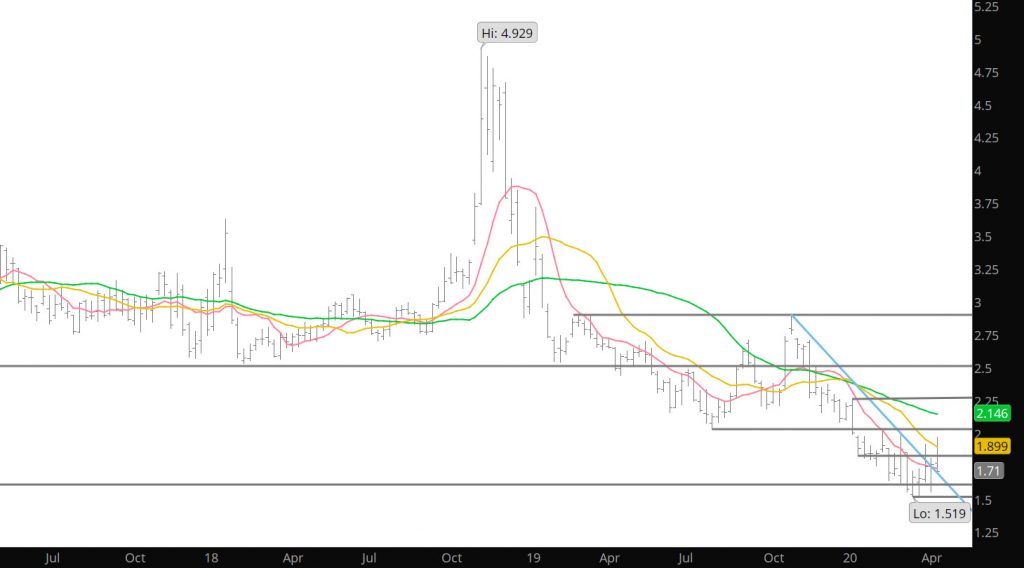
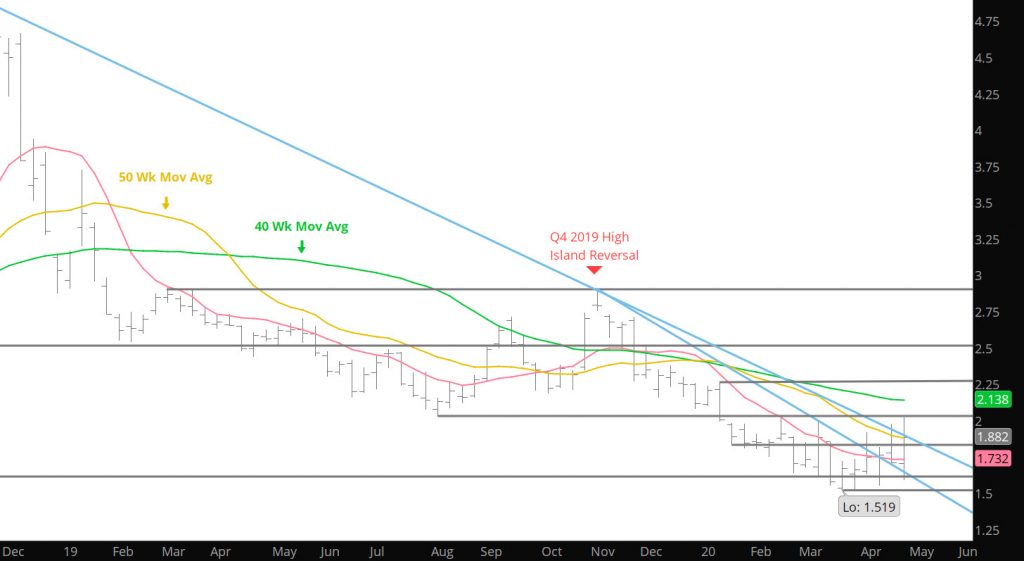
A series of close weekly closing prices have occurred during the May contract as prompt. Closing prices have been within a range of $.02 over the last three weeks ($1.733, $1.753 and $1.746). The two previous weeks were at $1.634 and $1.621. This type of price behavior usually precedes a significant price move as it has a tendency to bring attention to traders (yes we look at these elements in trade). In natural gas the last time this type of tight weekly closings was in December when there were four weekly closings ($2.281-$2.334) before prices before prices broke down and added to the recent Q1 declines. The previous tight weekly closes occurred last summer when prices constructed a tight weekly range between $2.119 and $2.169 over three weeks (July and August). This set up the rally to the September high ($2.71) and the eventual Q4 high of $2.905. I will be getting into the expectations of the June contract, as prompt, during this week with the final outlook next Sunday.
May Expiration Continues Weakly
Just a reminder — this will be the last week that the Daily will arrive in your email unless you subscribe to the website. Effective May 1, you will have to subscribe to the website to receive the Daily. This market seems to be forming a bias change and ecomenergy will be leading the analysis during the transition.
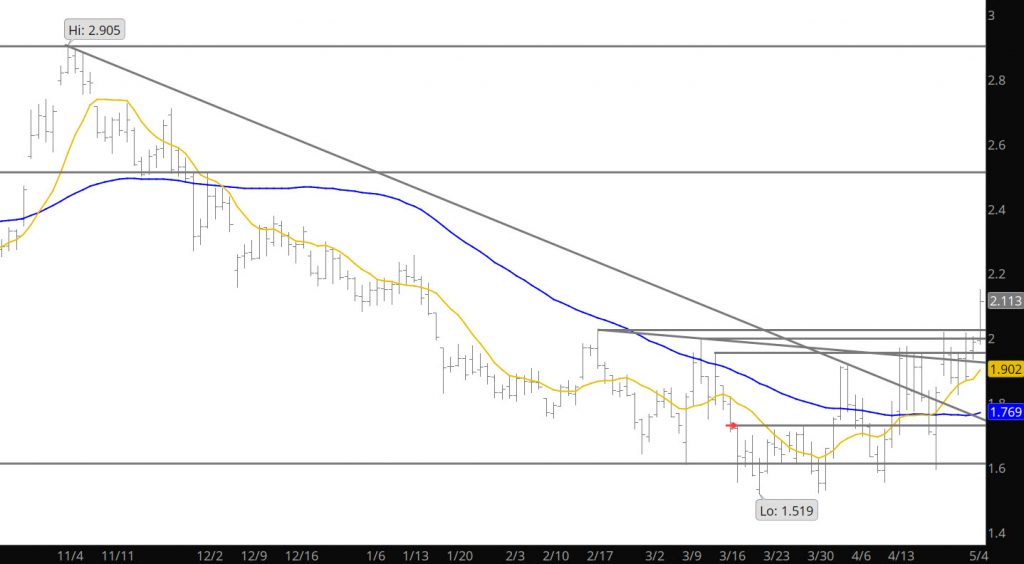
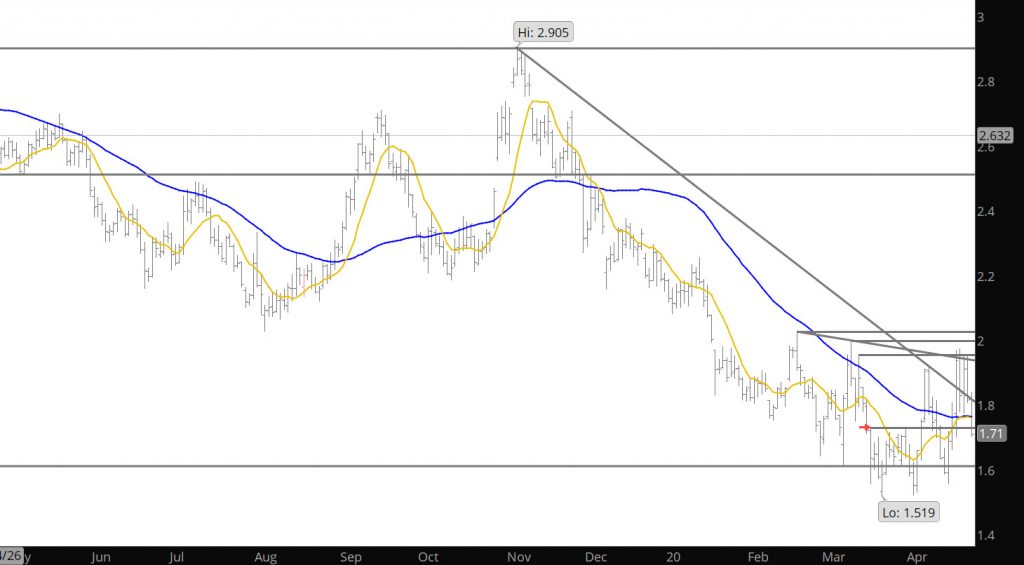
Prices closed the week just about where they started ($1.746 vs $1.753) the week after providing a solid rally to test resistance from the Feb and March highs ($2.025-$1.998) only to fail once again as discussed in the Daily last week. Only a couple of trading days remain in the May contract, and I would bet on a settlement between $1.61-$1.833.
Major Support: $1.611, $1.555-$1.519
Minor Support: $1.78-$1.765
Major Resistance: $1.993-$2.025, $2.062,$2.08-$2.102
Minor Resistance: $1.968