To read The Daily Call you must be a subscriber (Current members sign in here. ) Start your subscription today.
Author: Willis Bennett
Prices Collapse During Late Night Trade
To read The Daily Call you must be a subscriber (Current members sign in here. ) Start your subscription today.
After Close -Gap Closes
Discussed yesterday of potential for all of the excitement surrounding the opening on Sunday night (opening gap) to be mitigated during this week. The gap was closed during the early after close market — so now prices sit where they were at the highs on Friday. That price behavior is not a ringing endorsement for folks buying into November on expectations of additional price gains. That is not to say they can’t go higher, as any demand gains from forecasts will have a positive impact, but it looks like the idea regarding the short covering causing recent gains is accurate. This run just does not have the support from the total trading community yet — stay tuned.
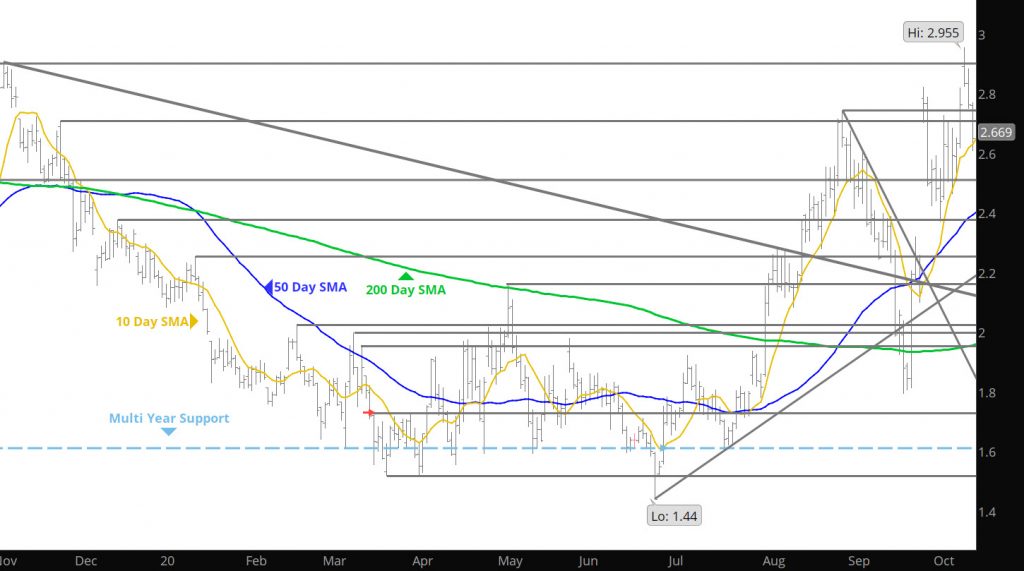
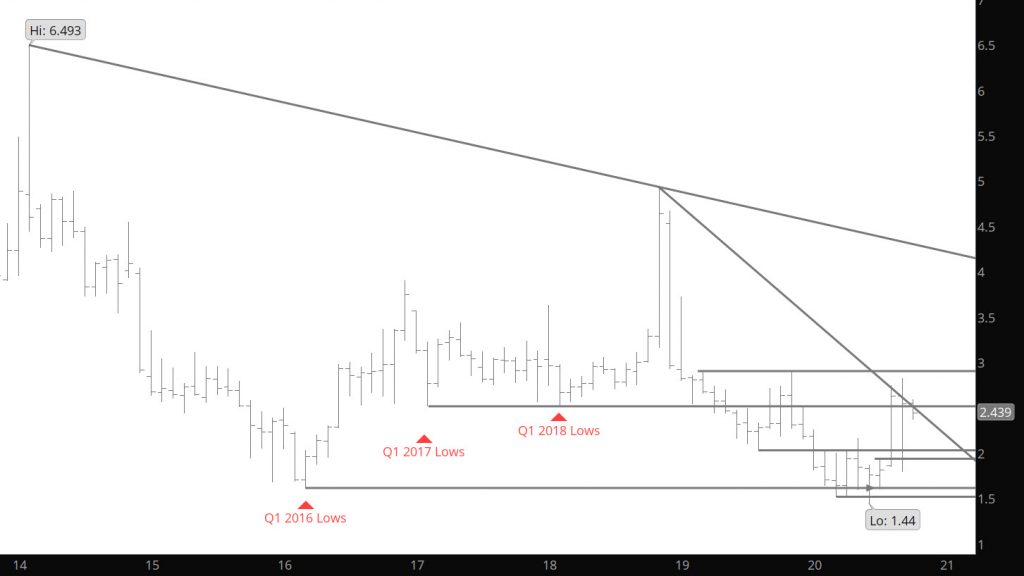
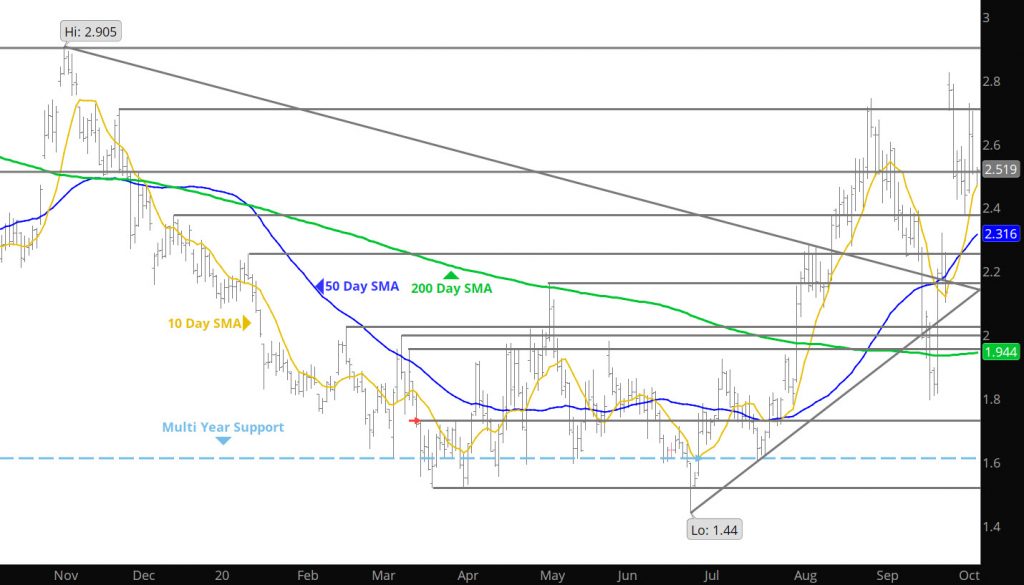
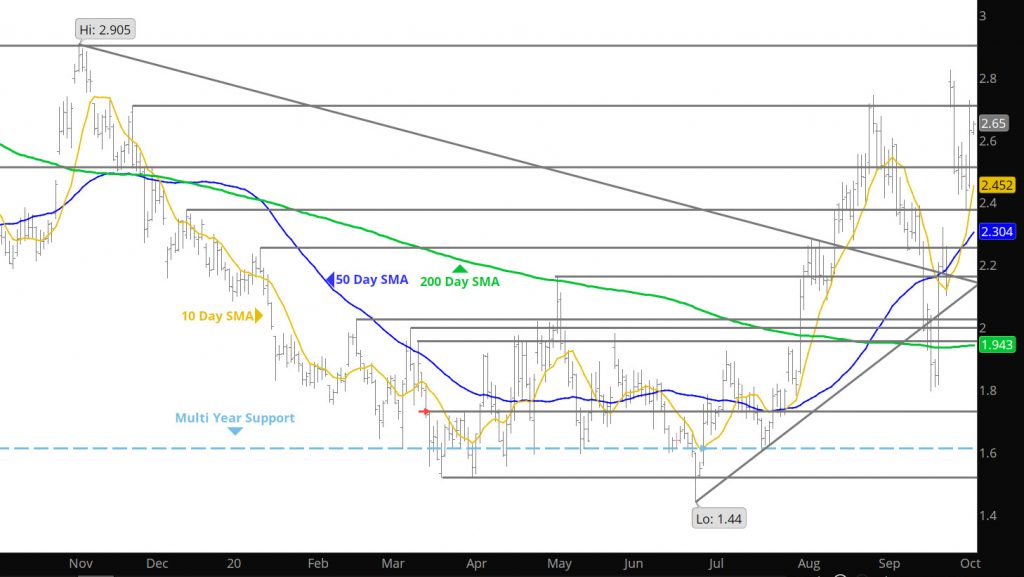
Major Support: $2.454, $2.392,$2.258-$2.253, $2.219
Minor Support: $2.74, $2.339
Major Resistance: $2.743, $2.789-$2.801,$2.908-$2.928,$2.973-$3.002
After Weak Start — Nov Firms
To read The Daily Call you must be a subscriber (Current members sign in here. ) Start your subscription today.
Prices Explode on Sunday Night
To read The Daily Call you must be a subscriber (Current members sign in here. ) Start your subscription today.
Action Edges Prices Higher
To read The Daily Call you must be a subscriber (Current members sign in here. ) Start your subscription today.
Little Change
To read The Daily Call you must be a subscriber (Current members sign in here. ) Start your subscription today.
The Range Re-enforces Resistance
To read The Daily Call you must be a subscriber (Current members sign in here. ) Start your subscription today.
Short Covering Rally Sends Prices to Where They Began
To read The Daily Call you must be a subscriber (Current members sign in here. ) Start your subscription today.
Prices Converge on the Premium to Nov
To read The Daily Call you must be a subscriber (Current members sign in here. ) Start your subscription today.