Historical Weakness Around Memorial Day Continues

Daily Continuous

History has a tendency to repeat itself and I have discussed the history for early June trade to weaken with the July as prompt. That happened again yesterday as price tried to break below last Friday’s low for July gas only to find buying once again. Seems like a fair amount of struggle is going on between the early morning camp which likes to send price down to support (speculation between 5 and 7 am CDT) followed by the physical delivery folks (between 7 and 9 am CDT). Not sure whats going on there but it is interesting to trade around. Again, the market is in a range trade environment for now and trade it accordingly.

Major Support: $1.611-$1.59, $1.555-$1.519
Minor Support: $1.82, $1.705-$1.649
Major Resistance: $1.90, $1.974, $2.019- $2.029
Minor Resistance: $1.864-$1.896

To read The Daily Call you must be a subscriber (Current members sign in here. ) Start your subscription today.

Prices Reverse Off New July Low

Daily Continuous
July Spot Contract

After trading down and setting a new low for the July contract early in the trade day, consolidated the declines for a while before prices found buyers and rallied through the remainder of the day. This left prices with a gain for the day. Go into some interesting trends for prices on the web site and encourage all to find 15 minutes to review. As for the daily prices, the reversal on Friday was quite impressive (from preliminary data from the CME) with the movement accompanied by highest volume of the week and gains in open interest.

For the last ten trade days, the market has traded in the range between $1.68 and $1.98 after exploding up to $2.16 before capitulating down to $1.595. Even with the expansion of the range some interesting trends for prices are explained on the web site and encourage all to find 15 minutes to review. With the close on Friday, prices now sit in the middle of the narrow ten day range. Pick your poison.

To read The Daily Call you must be a subscriber (Current members sign in here. ) Start your subscription today.

Market May Be Showing Signs of Bias Change

Weekly Continuous
Monthly Continuous

Looking at the charts over the weekend and found some interesting trends that have been developing since the lows were printed in the middle of March and retested at the end of March. Notice on the Weekly chart above, the market has now performed three (if you include last week’s mild run) distinct rallies only to succumb to selling pressures. These selling pressures have taken prices down but the lows from each decline has had a higher low. If you look at the trade action before the March low, any rally was pounded and developed a lower low after the failure of the rally since the Q4 high on the chart.

A similar trend is seen on the Monthly chart (albeit for only two months), with the May low staying above the April low. This subtle trend change does not eliminate the potential for additional declines, but rather is a subtle indication by the participants that interest in extending beyond the March, lows seemingly runs out of steam.

To read The Daily Call you must be a subscriber (Current members sign in here. ) Start your subscription today.

Slight Declines Continue

Daily Continuous

Spot July Contract

Prices continued the historical trend of declining in early July prompt trade but stopped at trend line support and lows established in March. If that support breaks- then expect trade to decline another dime. The market remains in the range but is starting to attack the premiums of the differed summer contracts, staying with in the range. That is a trading opportunity near term.

To read The Daily Call you must be a subscriber (Current members sign in here. ) Start your subscription today.

Prices Run To May Expiration

Daily Continuation

As discussed yesterday, the expectation was for prices to expire within a few pennies of May, as nothing has changed from a technical perspective. This author will let you fundamental folks to discuss the fundamental changes since the May expiration. What will be of more importance is the July contract trading in relation to the expiration as we may get more information to the seasonal historical trends discussed in the web site. Be patient and work the range.

Major Support: $1.611-$1.59, $1.555-$1.519
Minor Support: $1.705-$1.649
Major Resistance: $1.82-$1.849, $1.873, $1.90
Minor Resistance: $1.799, $2.029

To read The Daily Call you must be a subscriber (Current members sign in here. ) Start your subscription today.

Expect Some Further Weakness But???

Daily Continuous

Went into the historical aspect of this expiration, Holiday weakness and what to expect early in June on the web site. It is part of your subscription so when you get a chance during the day — bring it up. In terms of today and tomorrow (expiration), going out on a limb that June will settle with in a few pennies of where May expired ($1.794). Why– nothing has changed in the technical world except for the break out (on web site), but the collapse in prices, after, mitigated that move. Here we sit. All that an be traded on is the range until the market chooses to tell you where its next movement is.

To read The Daily Call you must be a subscriber (Current members sign in here. ) Start your subscription today.

June Expiration Follows History

Weekly Continuation

The trade last week followed the historical norms fairly well. The market had a pre-holiday rally that took prices just shy of the previous week’s high, only to find the appropriate selling and declines into the Holiday itself. Depending on how the positions are set- it is likely that there will be more weakness in the coming two days. That said, there has often been a short covering rally during the five day expiration process that has not occurred yet.

The trade in the June contract has created some interesting issues. While the Q2 rally has taken prices up to the 200 Day SMA and two standard deviations above the 20 week SMA, suggests that the Q2 high has occurred and currently met the historical averages. The twenty – year average of rallies from the Q1 low to the Q2 high is 47.6%, the five year is 33.3% with the lower numbers generated from the lower numbers in 2018 and 2019. The current rally from the Q1 low stands at 42.3% – well with in the norms. The only problem that keeps from confirming that is the average number of weeks to transition to the Q2 highs is substantially greater than the current six weeks.

To read The Daily Call you must be a subscriber (Current members sign in here. ) Start your subscription today.

Memorial Day Weakness Continues

Daily Continuous

Prices continued lower on the EIA report, even thought the injection was bullish compared to expectations. Looking at other commodity charts, I was struck with the recent rally in crude (WTI) and the monotonous decline in natural gas — it took me back to the fall of 2018 when trading houses were buying crude and offsetting that position with selling Natty. One got caught and pummeled into bankruptcy. Not sure if this is happening, but for the third consecutive day, I have heard suggestions in the market. Be aware of the potential– but continue to work the range.

Major Support: $1.611-$1.59, $1.555-$1.519
Minor Support: $1.649
Major Resistance: $1.82-$1.849, $1.873, $1.90
Minor Resistance: $2.029

To read The Daily Call you must be a subscriber (Current members sign in here. ) Start your subscription today.

Weakness Into Bearish Report —- Again

Daily Continuous

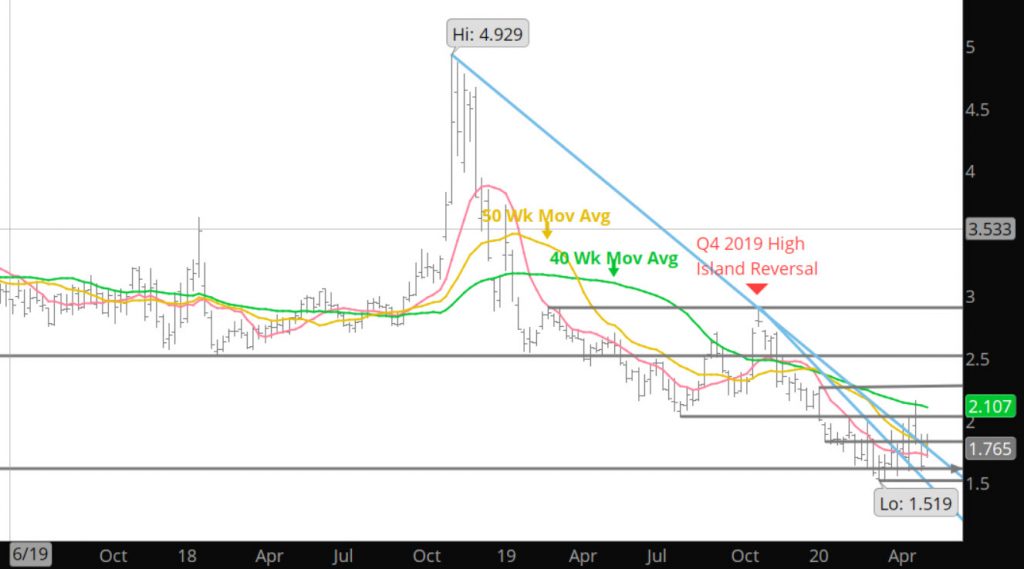
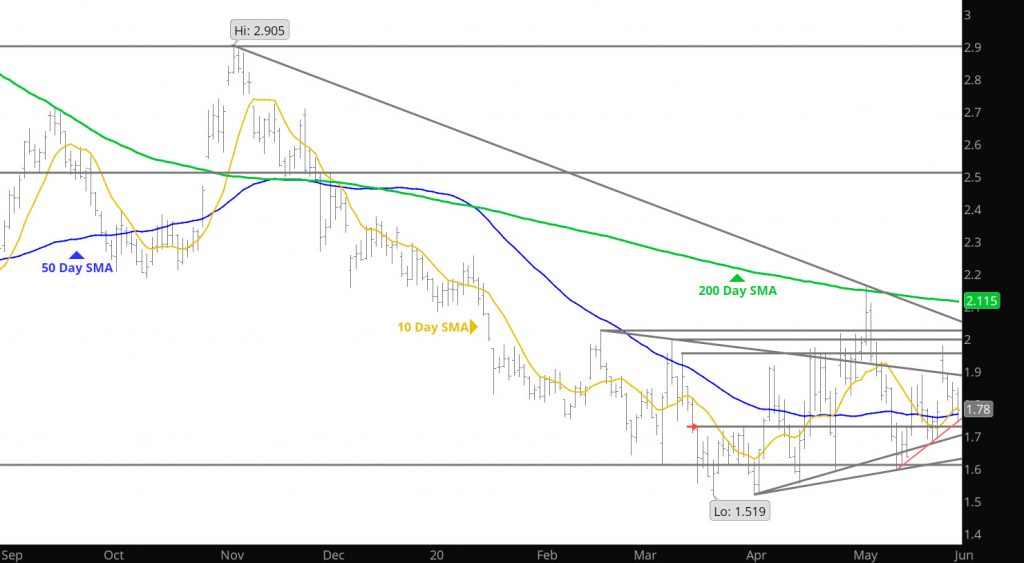
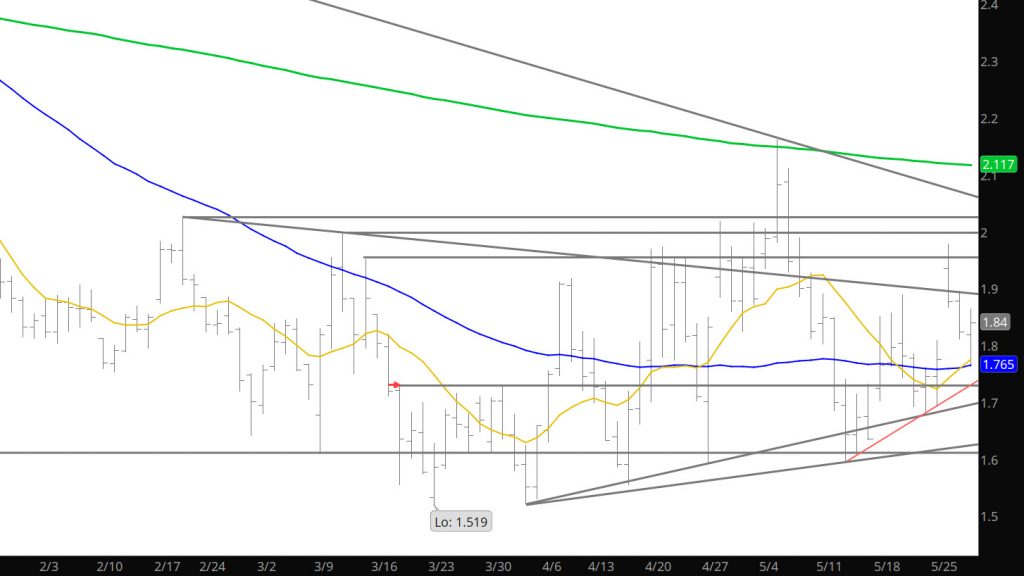
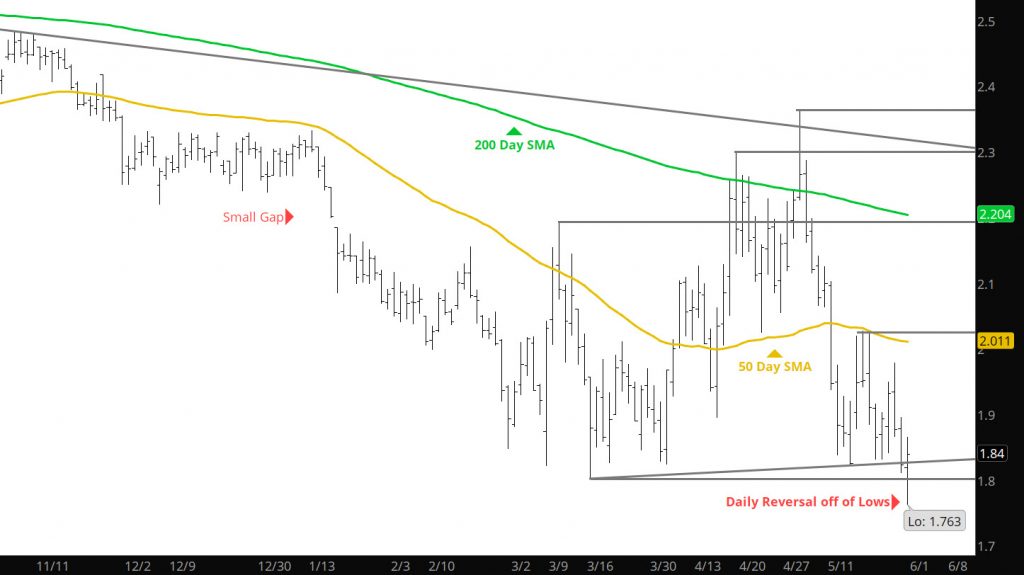
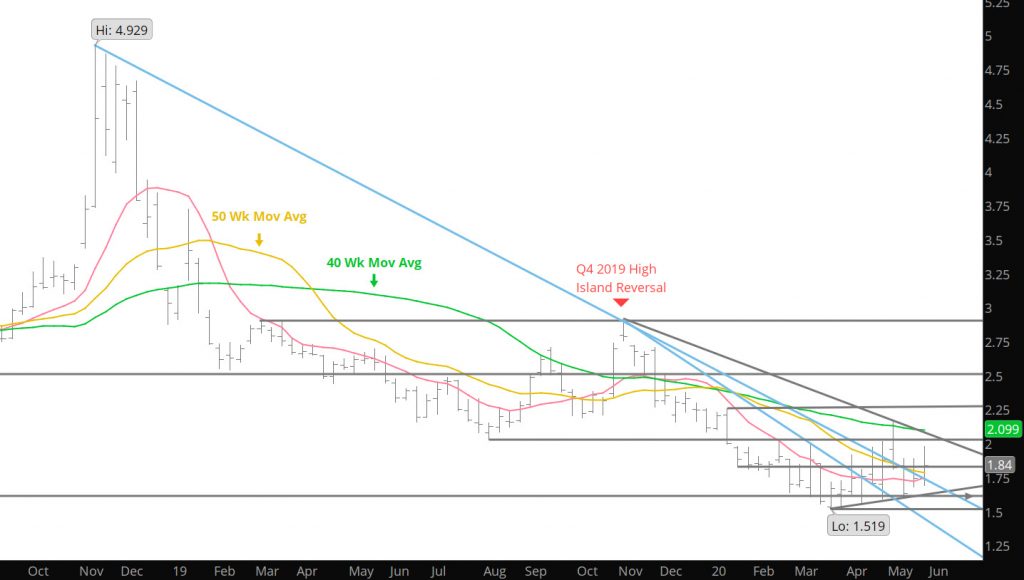
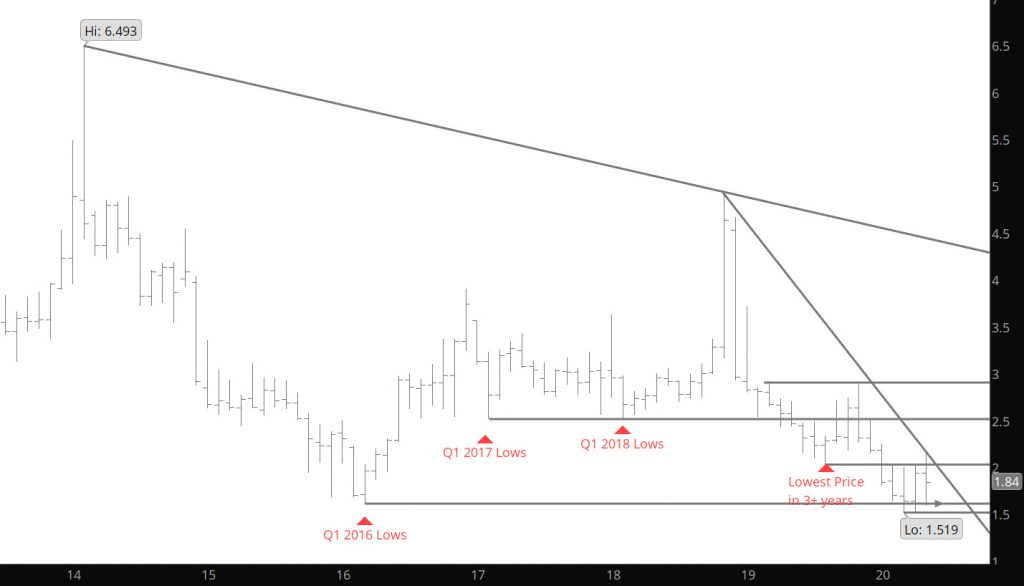
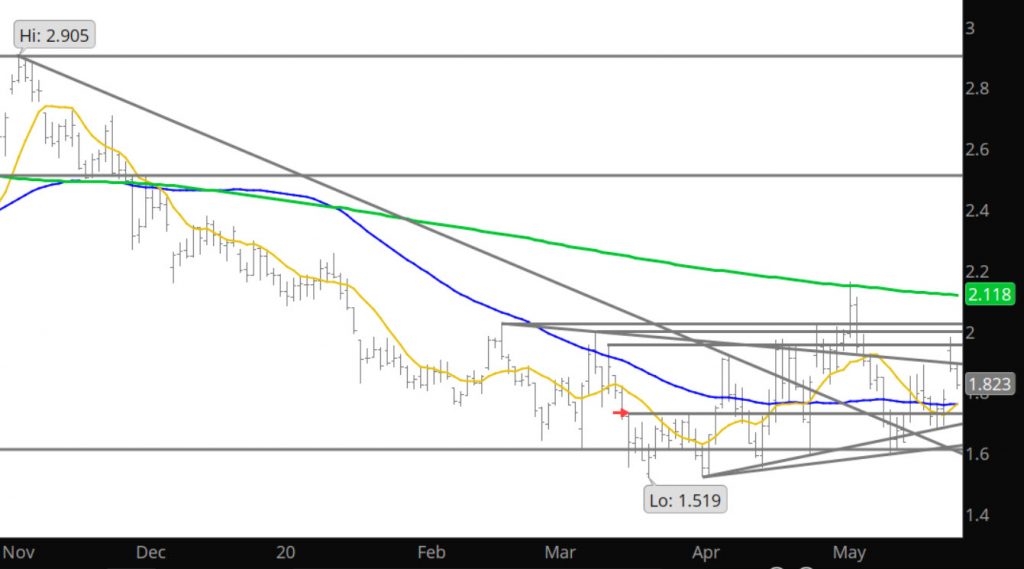
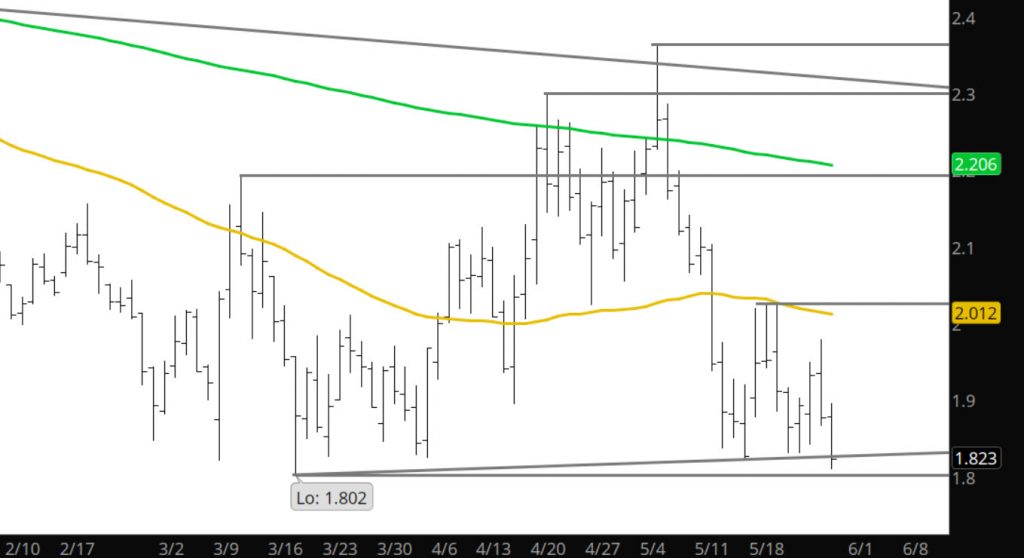
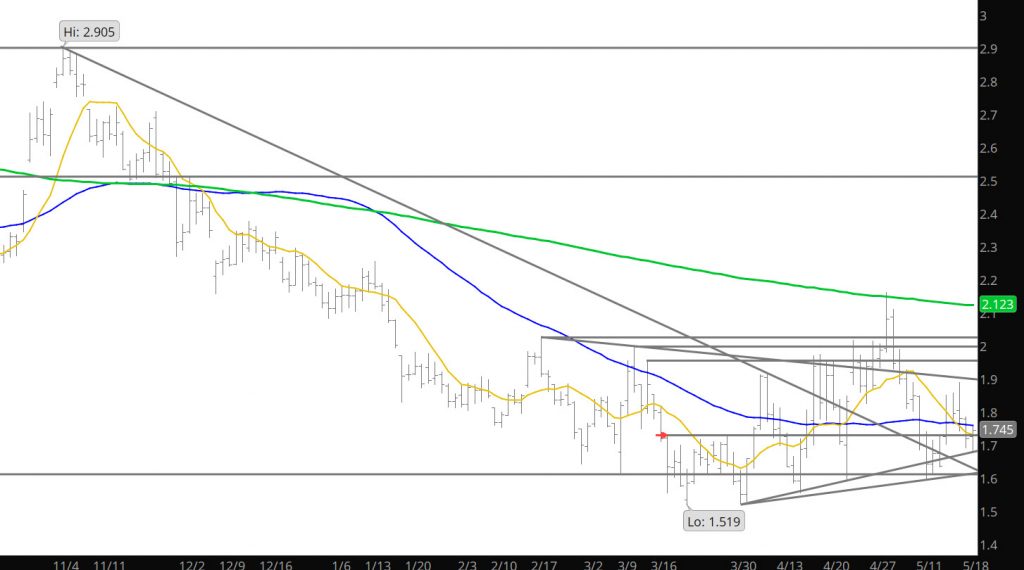
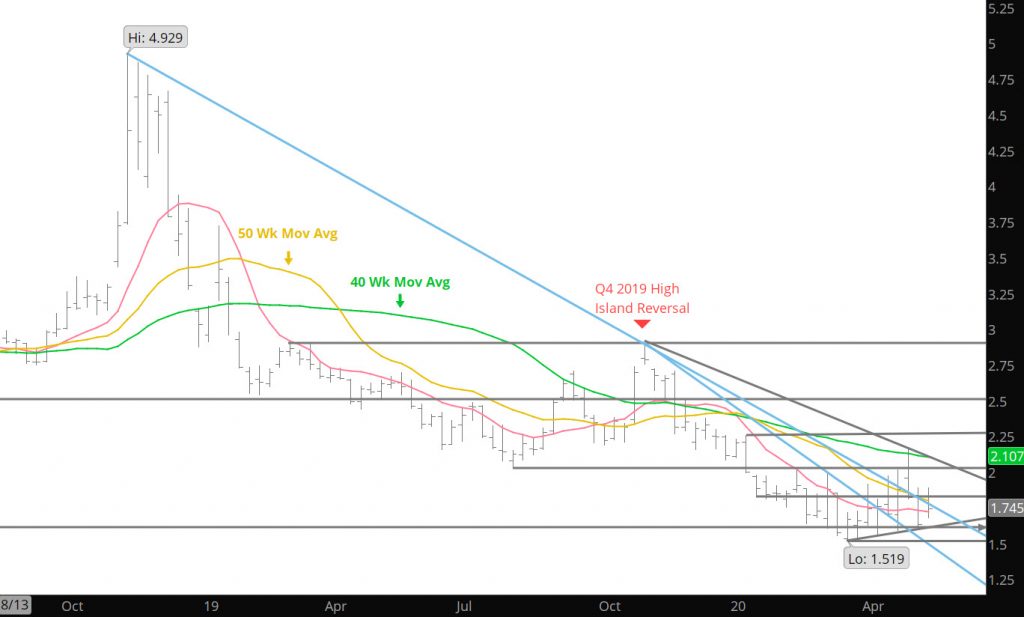
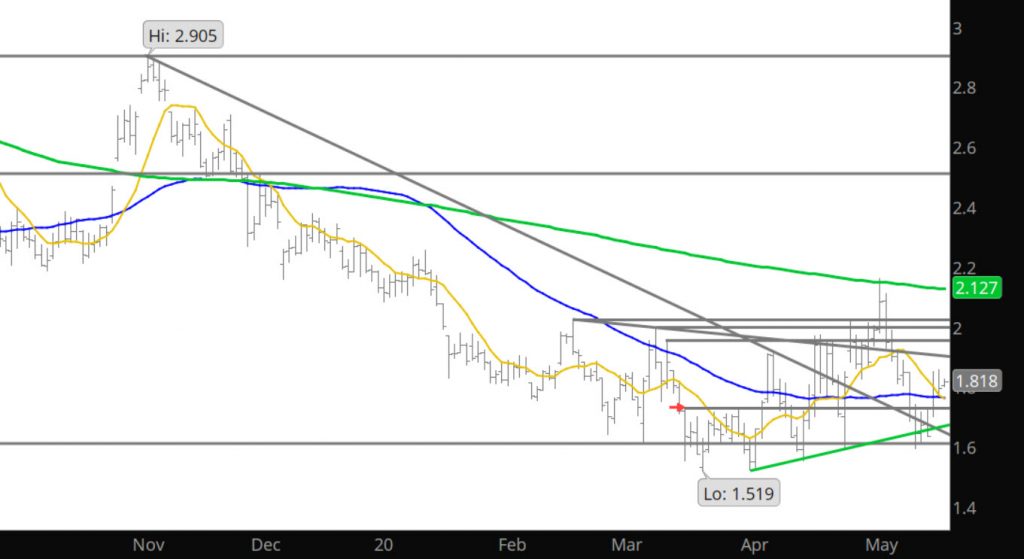
Pardon my sarcasm but for the last few weeks the Wednesday trade has been weak on low volume to set up for the storage report (which I hear, is going to be bearish — again). The question remains, do folks sell into the report only to run out of sellers? From a technical trade perspective continue to trade the range and sell the rallies (prices in the high $1.80’s and above), OH and buy the dips (low $1.60’s and below). History suggests weakness into, or just after, the holiday while the higher daily volume following the gaining price days.

Major Support: $1.611-$1.59, $1.555-$1.519
Minor Support: $1.649
Major Resistance: $1.82-$1.849, $1.873, $1.90
Minor Resistance: $2.029

Trade Consolidates Monday’s Gaines

Daily Continuous

Prices consolidated the gains from Monday and traded in a tighter range. Perhaps, the trade is building positions to move higher or developing positions to test support, but evidence either way is missing now. Traders would be wise to wait for clearer signals to initiate substantial new positions. Continue to play the book of the higher end of the range to be found before the historical trend of weaker prices either side of the Memorial Day holiday take hold.

Major Support: $1.611-$1.59, $1.555-$1.519
Minor Support: $1.649
Major Resistance: $1.82-$1.849, $1.873, $1.90
Minor Resistance: $2.029

To read The Daily Call you must be a subscriber (Current members sign in here. ) Start your subscription today.