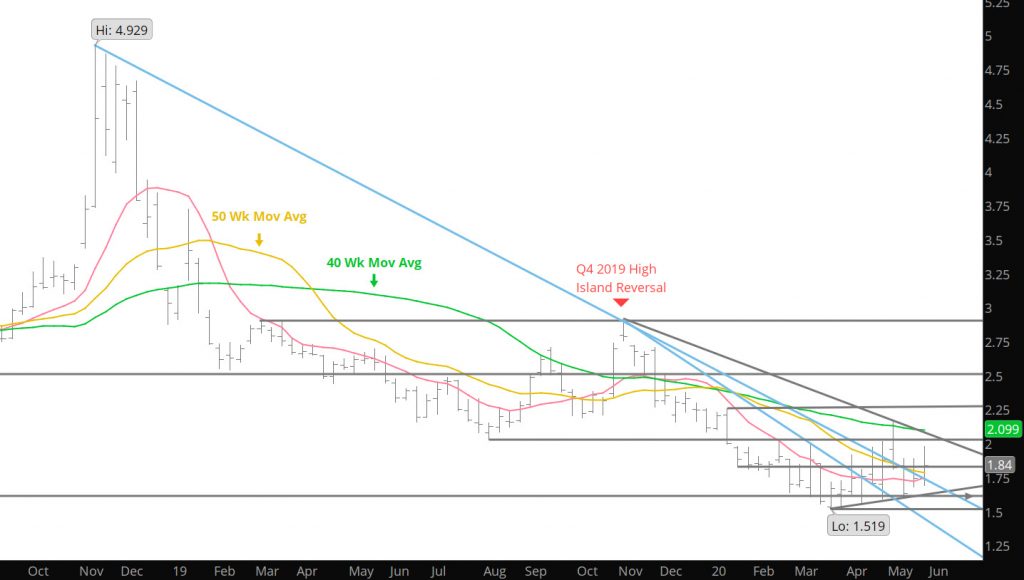
Looking at the charts over the weekend and found some interesting trends that have been developing since the lows were printed in the middle of March and retested at the end of March. Notice on the Weekly chart above, the market has now performed three (if you include last week’s mild run) distinct rallies only to succumb to selling pressures. These selling pressures have taken prices down but the lows from each decline has had a higher low. If you look at the trade action before the March low, any rally was pounded and developed a lower low after the failure of the rally since the Q4 high on the chart.
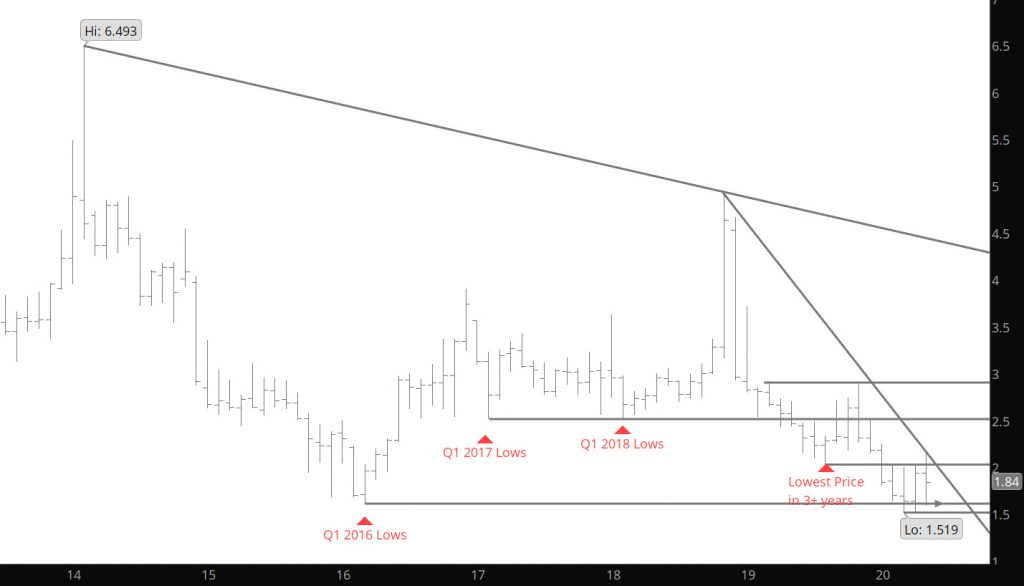
A similar trend is seen on the Monthly chart (albeit for only two months), with the May low staying above the April low. This subtle trend change does not eliminate the potential for additional declines, but rather is a subtle indication by the participants that interest in extending beyond the March, lows seemingly runs out of steam.