Daily Call

Sunday Night Signals a Rebound

Daily Continuation

Early trade shows a stronger opening for price on Monday– we shall see. Technical input continues to have the short term market over sold but the action on Friday severely reduced the extreme levels. Think some of the selling on Friday was bulls being excited about being able to get out of losses at a significantly higher prices than earlier last week.

Major Support: $5.623, $5.59-5.572, $5.06
Minor Support: $5.548, $5.40-$5.45
Major Resistance: $6.34-$6.43, $6.587, $6.638

To read The Daily Call you must be a subscriber (Current members sign in here. ) Start your subscription today.

Suggested Rally Commenced

Daily Continuous

Been warning about the potential of a rally like yesterday for a few days and the storage report provided the fuse for ignition. Look at the CFTC report action of the Managed Money Short position as they gained over the last few weeks.

Daily Continuous with CFTC Speculative Short Position

It is not surprising that while total open interest has been declining, the speculative shorts have now established at over 22% (last report June 28) of the total open interest. Where do prices go from here– unknown– but the rally is unlikely to end immediately and may start to define the high side of an upcoming summer range.

To read The Daily Call you must be a subscriber (Current members sign in here. ) Start your subscription today.

Consolidation Type Trade

Daily Continuous

Prices spent another day in a rather quiet day range– almost like the consolidation pattern discussed here several times. May be setting up for a run or developing the potential for additional declines. Likely, the set up is for the upcoming storage report (utilizing that for the volume for the directional push). Runs will find sellers at or around $6.00 while declines will need to break below and close below $5.40-$5.35.

Major Support: $5.623, $5.59-5.572, $5.06
Minor Support: $5.548, $5.40-$5.45
Major Resistance:$6.021, $6.34-$6.43, $6.587, $6.638

To read The Daily Call you must be a subscriber (Current members sign in here. ) Start your subscription today.

An Extension Though Slight

Daily Continuous

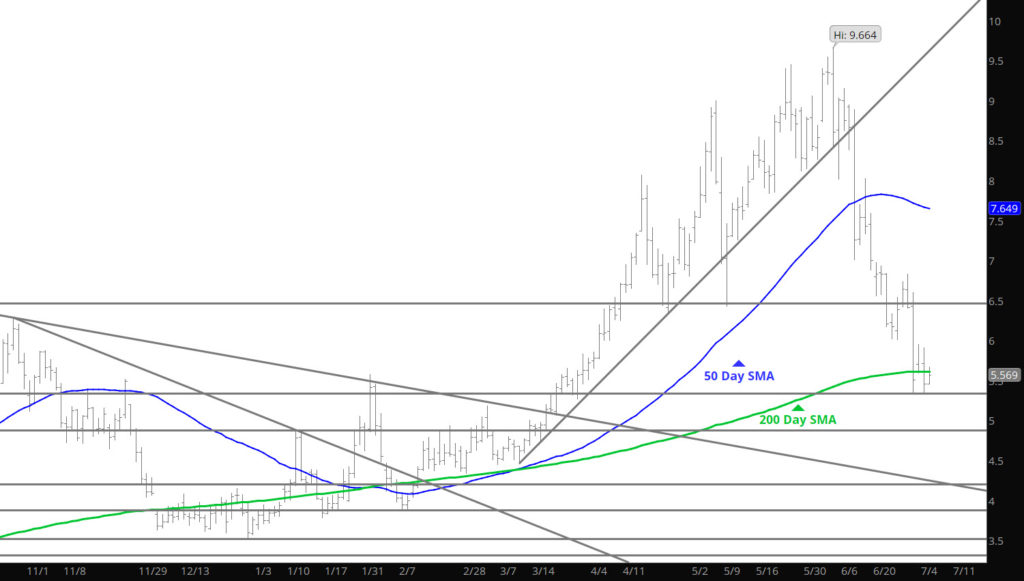
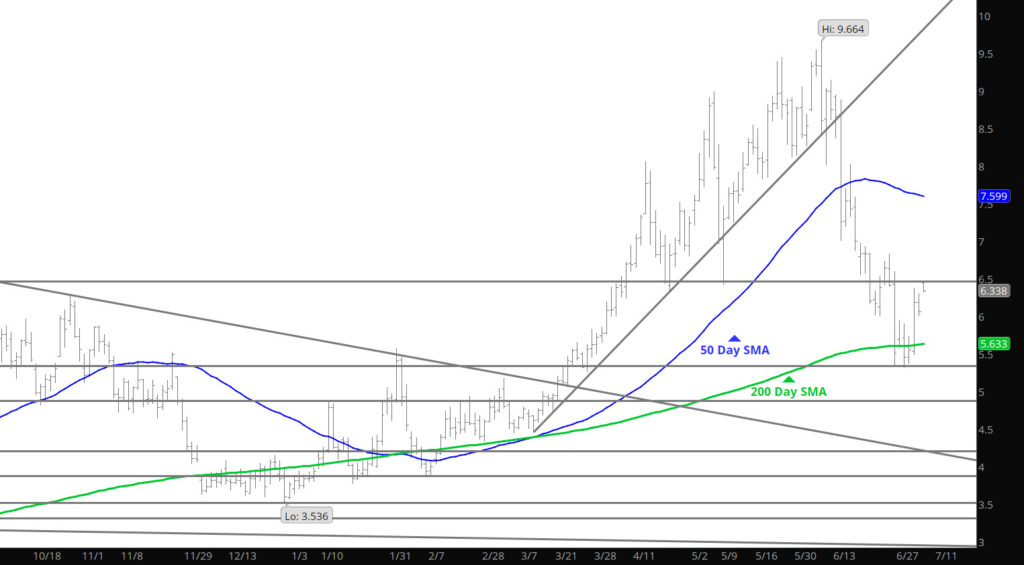
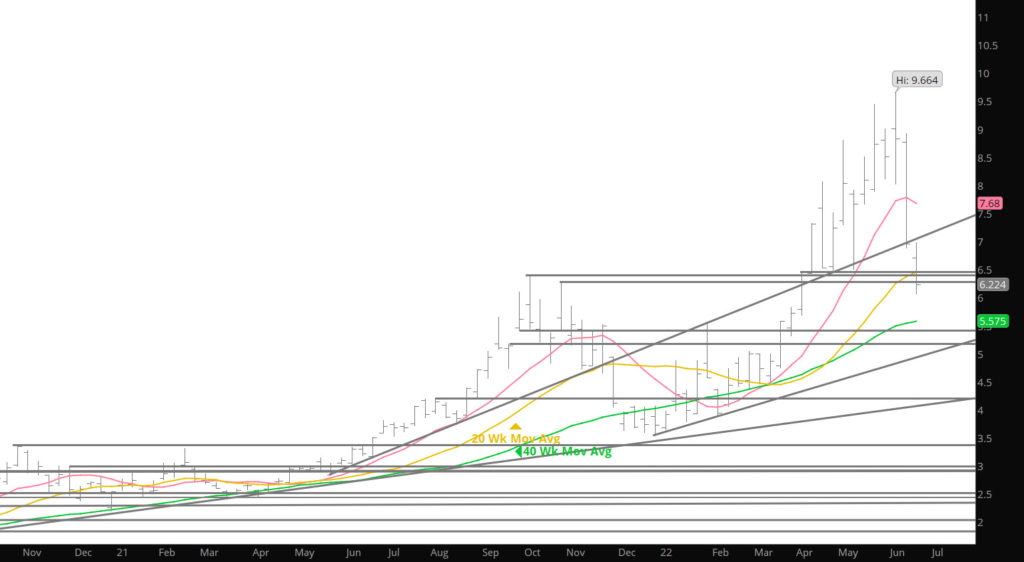
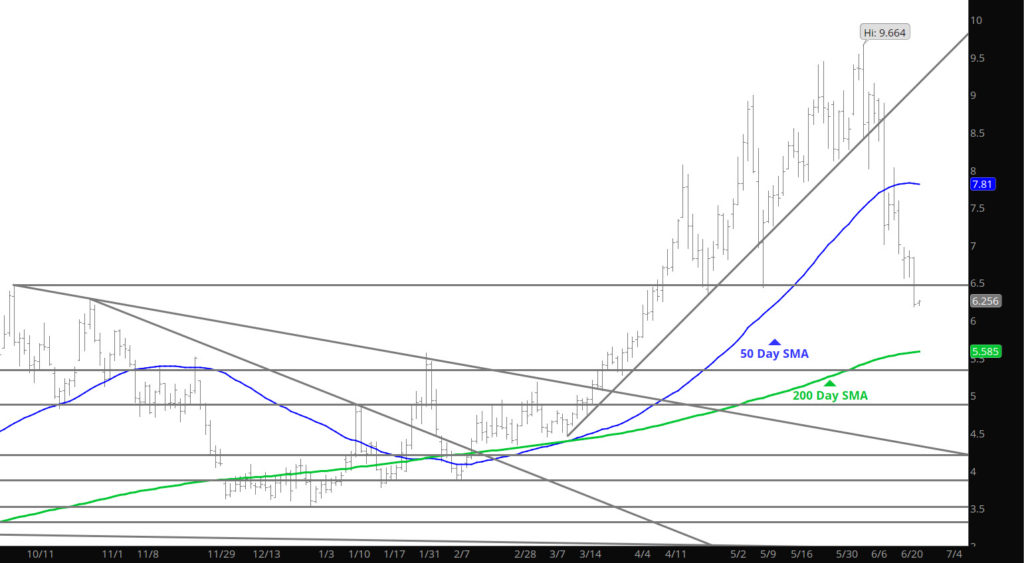
Price challenged the support from last week — just below the 200 day SMA but similar to last week, prices found support and bounced slightly upward. This is a near term support area and would not advise large buying. The market is over sold on numerous technical stand points (mostly daily in focus) and will eventually allow for a significant rally—- eventually. In the meantime it looks to be a sell any rally focus.

Major Support: $5.623, $5.59-5.572
Minor Support: $5.548, $5.40-$5.45
Major Resistance:$6.021, $6.34-$6.43, $6.587, $6.638

Definite Technical Damage

Weekly Continuation

Trade took prices through and close below first the short and then intermediate term trend lines (support). This move extinguished all but the long – term upside bias for prompt gas. Continue to expect wide trading ranges as the gas market attempts to define support. Prompt gas got way too far over its skis this spring and is making an extraordinarily volatile adjustment…retracing 50% of the rally from the June ’20 low in only sixteen trading days. While that decline/retracement extinguished the near term and intermediate term upside biases the long – term uptrend remains.

During the uptrend that first began following the June ’20 multi – year low a long series of higher highs and higher lows has been discussed here and was clearly observable. Short – term, intermediate – term and long – term trend has been definable with trend lines, by following moving averages and by seasonal and monthly lows. After flirting with violating the short – term uptrend in early May and early June, on 06/21 prompt gas decisively violated the trend line rising from the March – April lows and the 20 – day SMA. That decline and close ended the short – term uptrend. That decline and close ended the short – term uptrend. That same day prompt gas closed under the 50 – day SMA confirmed three days later. That violation was quickly followed by a close below the late April and May lows…the conventional support that comprised the last higher intermediate term low. Closes under the 50 – day and the May low ended the intermediate term uptrend.

To read The Daily Call you must be a subscriber (Current members sign in here. ) Start your subscription today.

Silent Trade Day

Daily Continuous

Seems the market wants to digest it positioning here as it heads into a light holiday trade weekend. One of the lightest volume days of late. My positioning has not changed will be buying any dips in winter contracts, trying to offset the volatility that may occur in the prompt month. Want to wish you all a great Independence Day celebration as I will not be posting a Daily tomorrow.

Major Support: $6.245, $6.02
Minor Support: $6.19-$6.175
Major Resistance:$6.684, $7.005, $7.66, $7.725, $7.816, $7.955

To read The Daily Call you must be a subscriber (Current members sign in here. ) Start your subscription today.

Quiet (Compared to Recent) Expiration

Daily Continuous

Not sure how to qualify that expiration– prices declined during the beginning of the process– only to find strength the last two days — was the expiration well bid — I would suggest that 10% gains off of the lows signifies a well bid situation for the 16th consecutive month but the strength only took prices back to where they started– so you can’t call it a rally into expiration. Perhaps I will refer to it as a 15+ month trend. What is left for the August contract to take over as prompt and with the recent rebound, perhaps a slight extension of the recent gains. One element is a given — open interest continues to decline (expiration partially responsible) so the potential for volatility is great.

Major Support: $6.245, $6.02
Minor Support: $6.19-$6.175
Major Resistance:$6.684, $7.005, $7.66, $7.725, $7.816, $7.955

To read The Daily Call you must be a subscriber (Current members sign in here. ) Start your subscription today.

Is the Bull Run Over?

Weekly Continuous

Price extended the losses and collapsed below the major support between the April and May lows ($6.247-$6.426) and closing the week below the higher low established during those months. This extension occurred with lower volume (partially due to the holiday), but more important is the decline in open interest. The market is now at the lowest level of open interest since the collapse in Jan ’16 and the Q3 low established in Jul’16. Notice that both of those were lows as the market was struggling with declines and position by the hedging community. Similar to current conditions as traders are not sure how to deal with the one year effects from the war and the LNG situation. It is clear that the recent collapse was partially due to a re-assessment by the fundamental condition from LNG demand loosing 2 Bcf/day (displacing that gas into storage) and the destruction of technical support levels.

So is the bull run over –not sure as if you look at the last lower low, in the chart below, prices traded around the lows for three weeks before breaking out to the upside (2nd chart below).

To read The Daily Call you must be a subscriber (Current members sign in here. ) Start your subscription today.

Collapse Takes Prices to a Lower Low

Daily Continuation

The break down last week had serious technical ramifications (discussed in the Weekly Section) but clearly the close below the major support area bodes for additional declines. The only issue with that is the 15 month trend for expiration being bullish– can prices rally above $6.884 (five day open) to keep that trend securely in track but any serious rally up to the $6.60 will keep the trend open for discussion.

Major Support: $6.245, $6.02
Minor Support: $6.19-$6.175
Major Resistance:$6.684, $7.005, $7.66, $7.725, $7.816, $7.955

To read The Daily Call you must be a subscriber (Current members sign in here. ) Start your subscription today.

Declines Break Support and Challenge Bull Bias

Daily Continuous

Volatility game on big time and prices are selling rallies — does define the end of the bull run since the fall of 2020– no. Does it show the conclusion of the run in 2022 — not sure. Have we finished the expiration process and 15 month trend — not even close– three trading days left and need I remind anyone of the February expiration that sent prices to the first test over $7.00 during the process. Technical damage has occurred this week to the run but prices closed yesterday in that key area between the early April low and early May low (see chart below).

Weekly Continuation with Higher Highs and Higher Lows

Will get into more assessment of the break down on this chart over the weekend if it occurs.

To read The Daily Call you must be a subscriber (Current members sign in here. ) Start your subscription today.