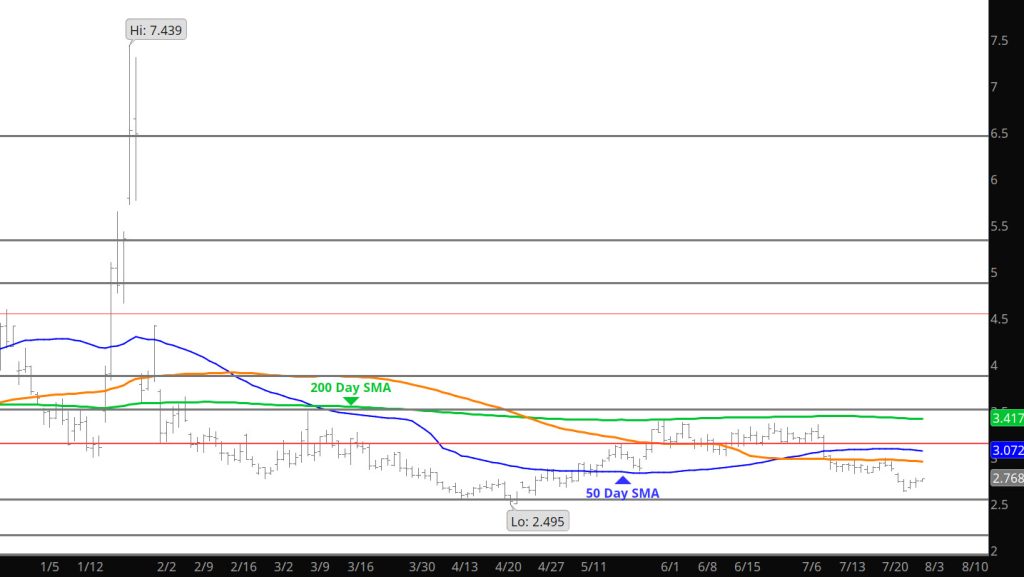
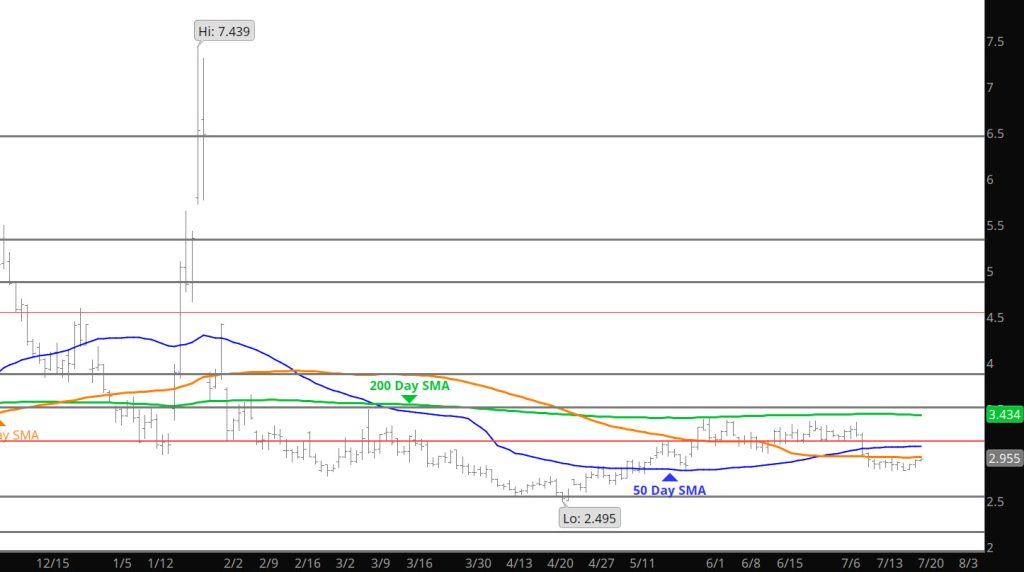
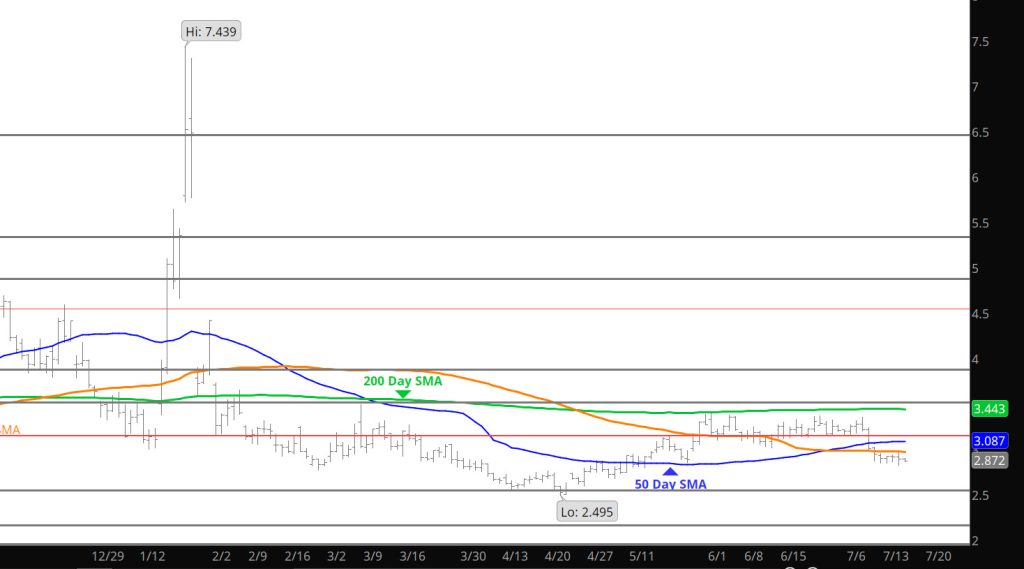
The storage release supported the market for the first time in weeks and took prices back into the recent range as the September contract becomes prompt. Waiting to see how the market responds at the end of the week thereby setting up some technical analysis.
Major Support: $2.73, $2.676, $2.640-$2.57 Minor Support/Resistance : $2.87-$2.84,$3.16-$3.148, $3.136, $3.02-$2.97 Major Resistance: $3.35, $3.486-$3.494, $3.567,$ 3.736
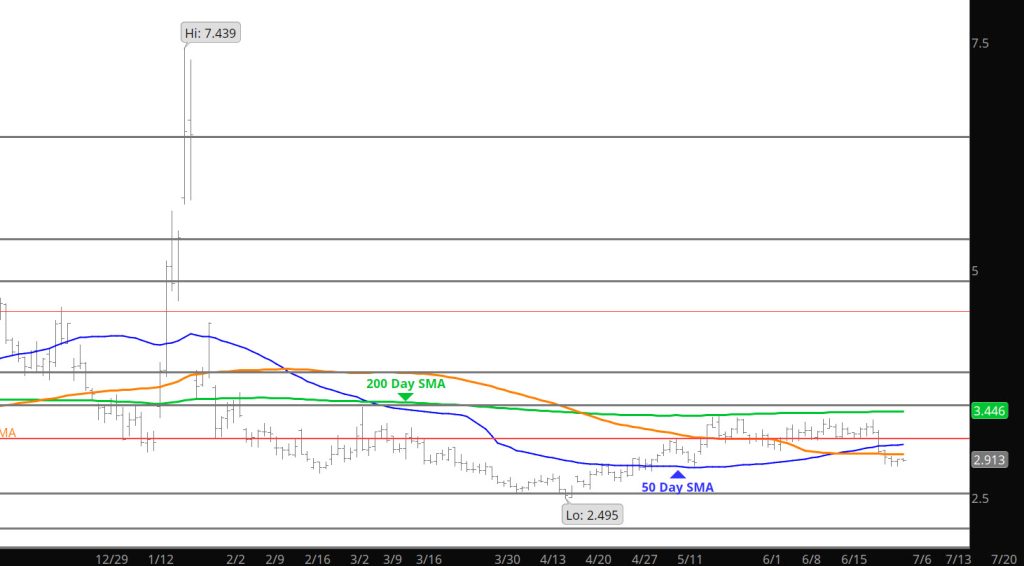
Discussed in the Weekly that prices were likely to extend declines–accomplished. Now what, Volume did not seem strong so I am sitting on the sidelines for adding to shorts.
Major Support: $2.73, $2.676, $2.640-$2.57 Minor Support/Resistance : $2.87-$2.84,$3.16-$3.148, $3.136, $3.02-$2.97 Major Resistance: $3.35, $3.486-$3.494, $3.567,$ 3.736
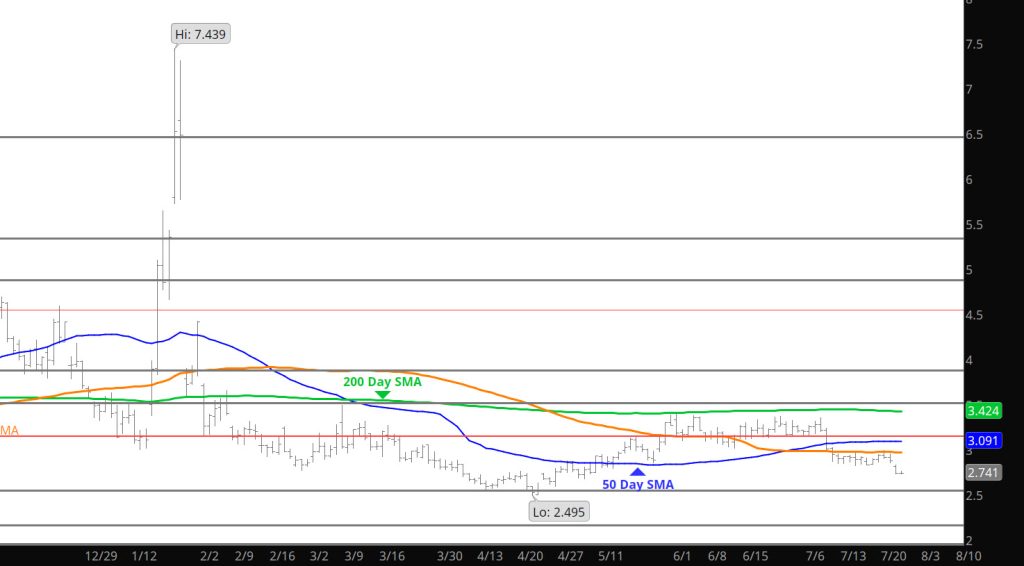
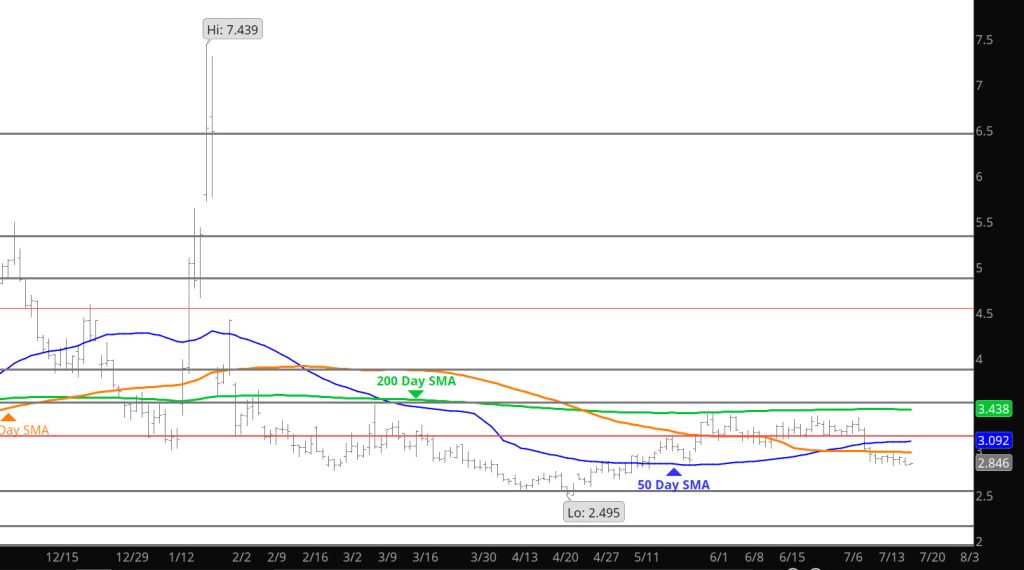
Per the discussion in the Weekly Section, prices extended the lows on Sunday night trade. Would expect the declines to test the support levels $2.72-$2.78 before the expiration this week, but below the July expiration.
Major Support: $2.73, $2.676, $2.640-$2.57 Minor Support/Resistance : $2.87-$2.84,$3.16-$3.148, $3.136, $3.02-$2.97 Major Resistance: $3.35, $3.486-$3.494, $3.567, $ 3.736
Soon to expire August, which rallied from last week’s low of $2.823 to$ 2.991, traded back to back tight weekly ranges (last week $.145 from low to high…the tightest weekly range in memory, this week $.160) but was the only contract month to end the week with a loss. The consensus of technical indicators, which remained neutral (with a fluctuating bias) for the entire second calendar quarter, is negative for a second week.
The weekly MACD, our primary “lagging” indicator, which confirmed a negative calculation last week, is negative for a third week. The daily MACD, the daily and weekly RSIs are negative and are not yet giving extremely oversold warnings. Market internals are neutral. Average daily volume fell a little as August traded between support and resistance.
A test of the resistance is very likely going into the storage release. Should the bulls carry prices further then the question becomes the break out level to the upside.
Major Support: $2.640-$2.57 Minor Support/Resistance : $2.87-$2.84,$3.16-$3.148, $3.136, $3.02-$2.97 Major Resistance: $3.35, $3.486-$3.494, $3.567,$ 3.736
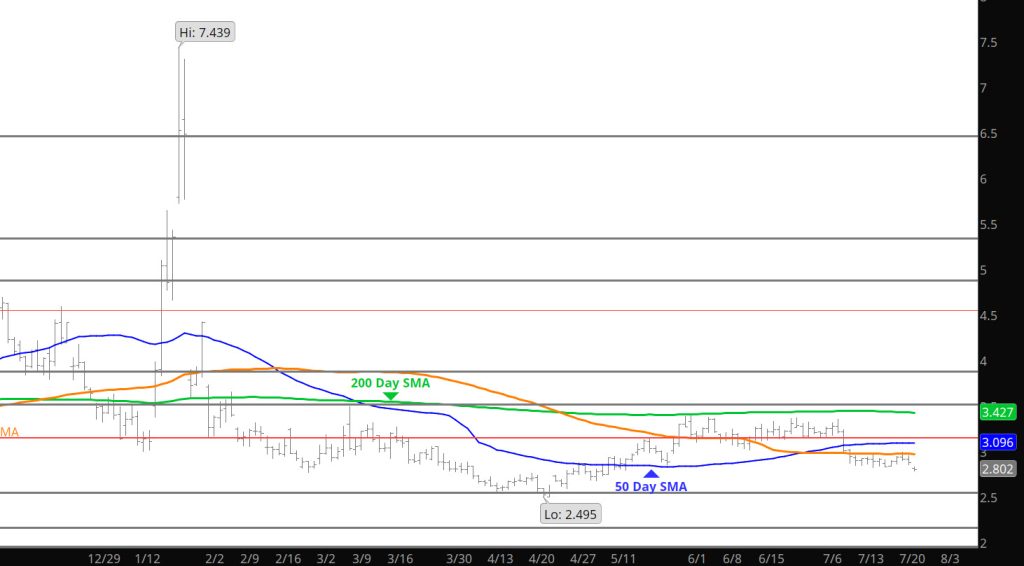
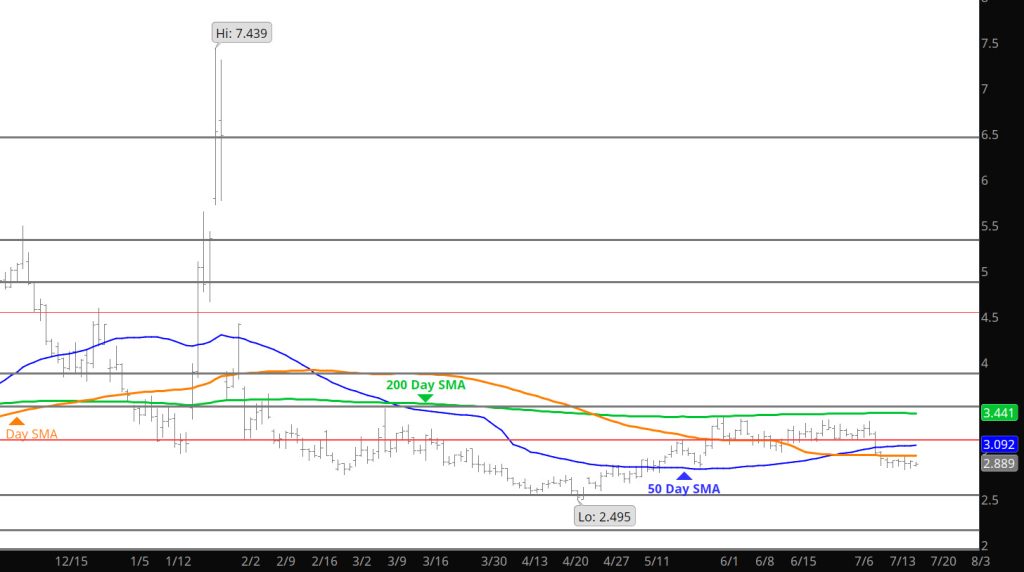
Prices continued to decline and tested last week’s low. This week will be instructive for near term trade– if prices hold or additional declines at a slow pace.
Major Support: $2.640-$2.57 Minor Support/Resistance : $2.87-$2.84,$3.16-$3.148, $3.136, $3.02-$2.97 Major Resistance: $3.35, $3.486-$3.494, $3.567, $ 3.736
Go into the technical implications from last week’s trade in the Weekly Section– suffice to say we are now entering a new (lower) range environment, Would expect a test of the $3.10-$3.15 area if history is any guidance as a bump off of the recent selling and breakdown is warranted.
Major Support: $2.640-$2.57 Minor Support/Resistance : $2.87-$2.84,$3.16-$3.148, $3.136, $3.02-$2.97 Major Resistance: $3.35, $3.486-$3.494, $3.567, $ 3.736
After losing $.256 a week ago August closed $.029 lower, while trading a total range for the week of $.145 that may suggest at least a temporary loss of downside momentum. August gas spent six trading days testing the same zone that provided resistance during the first half of May and then support for expiring June just after Memorial Day . Volume during the last five of those six days was lower than the corresponding day the week before…no technical surprise that prompt gas held the support. As a rule, a volume increase is required to overcome the bids at a defined support zone. August traded an outside day reversal on Thursday and posted a low daily close of $2.858…the lowest daily close since then prompt June closed at $2.843 on 05/12. If August was going to breakdown, it missed a good chance, but the sufficient offers clearly were not present.
On a daily closing basis, prompt gas closed between +/- $2.550 and $2.850 for twenty six days between April 1st and May 13th (there was one close higher, three lower during that period). That zone was tested this week…expect it to continue to present daily closing support but also that it will be retested during late July, August and early September. Note that September is currently $.035 discount to August. A year ago on 07/17 September closed $.034 premium.
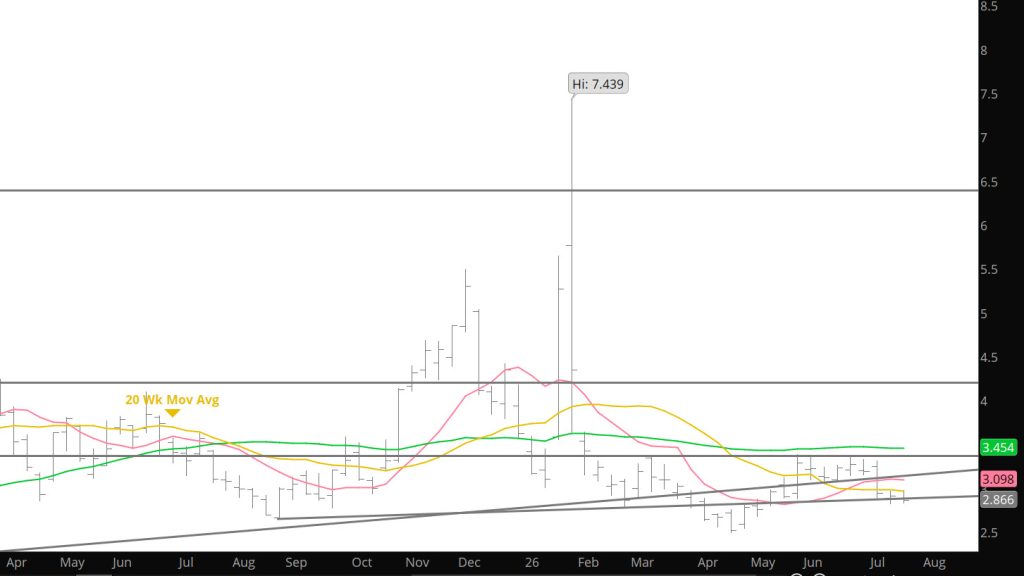
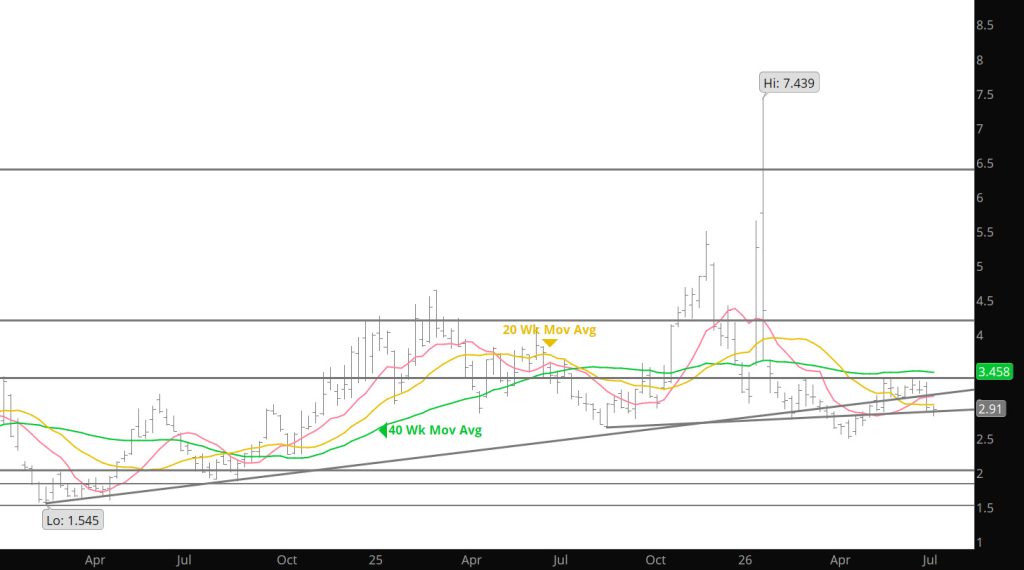
Following the seasonal pattern during July…and particularly the period bracketing Independence Day, August was expected to trade a low between the 10th and 20th…this week’s low traded on 16th and brought the early July decline to 18% (vs a five years average of 18.9%). While as mentioned in previous editions, there have been years when August faded for its entire tenure as prompt, far more often a post – holiday mid – July low precedes a rally to test resistance. Expect the zone between $3.10 and $3.15 is a likely target before a fade into contract expiration.
A year ago August ’25 traded a temporary oversold, seasonal low on 07/09 and then rallied to retrace a little less than 50% of the decline from the Q2 high, tested similar resistance then failed. Expect seasonal pressure to ebb and flow weighing on the entire maturity curve for another sixty days. The average of the last twenty declines from Q2 highs is 31.6%…which would suggest some likelihood of a test and possible undercut of the April low. Full maturity of the annual cycle will occur in 4 – 5 weeks, or roughly during the last week or so of September’s tenure as prompt…which will also be full maturity of the short – intermediate term cycle measured from the April low. The best guess is that the gas market will feel seasonal pressure into that late August/early September period and the period bracketing Labor Day (which is 09/07 this year).
The consensus of technical indicators, which remained neutral (with a fluctuating bias) for the entire second calendar quarter ended the week negative for the first time since just following the failure at the January high. The weekly MACD, our primary “lagging” indicator, that had remained positive for eight weeks rolled over. The daily MACD and weekly RSI are negative and are not yet giving extremely oversold warnings. Market internals which were neutral with the suggestion of a price negative bias last week improved a little. Average daily volume (which accelerated significantly a week ago as prompt gas fell hard) and the highest since the two weeks leading into and of the week of the March high, dried up as August traded a lower low…a technical positive.
Open interest increased 21,500 contracts as August edged lower…my guess is that increase can be attributed to short sellers getting a little too far out over their skis. Thursday’s total was 1,672,716 total contracts outstanding. The last time open interest was as high, 1,676,152, was week ending 05/29. The time before that, 1,680,104, was the week immediately preceding the January low. Those are the high week ending totals since last October…both accompanied a turn in the market.
Major Support: $2.640-$2.57 Minor Support/Resistance : $2.87-$2.84,$3.16-$3.148, $3.136, $3.02-$2.97 Major Resistance: $3.35, $3.486-$3.494, $3.567,$ 3.736
The bearish release provided some downward momentum (like last week) only to find buyers similar to last week. Perhaps the market is struggling to send prices down to major support– I will be interest to see if any divergences have developed after the weekly action.
Major Support: $2.640-$2.57 Minor Support/Resistance : $2.87-$2.84,$3.16-$3.148, $3.136, $3.02-$2.97 Major Resistance: $3.35, $3.486-$3.494, $3.567, $ 3.736
Looks like the sellers ran out of momentum (perhaps waiting for the next storage report) and now has developed a new small range for trade. Would not be an aggressive seller at these levels as major support just lower is relevant and stopped the declines last week.
Major Support: $2.640-$2.57 Minor Support/Resistance : $2.87-$2.84,$3.16-$3.148, $3.136, $3.02-$2.97 Major Resistance: $3.35, $3.486-$3.494, $3.567, $ 3.736