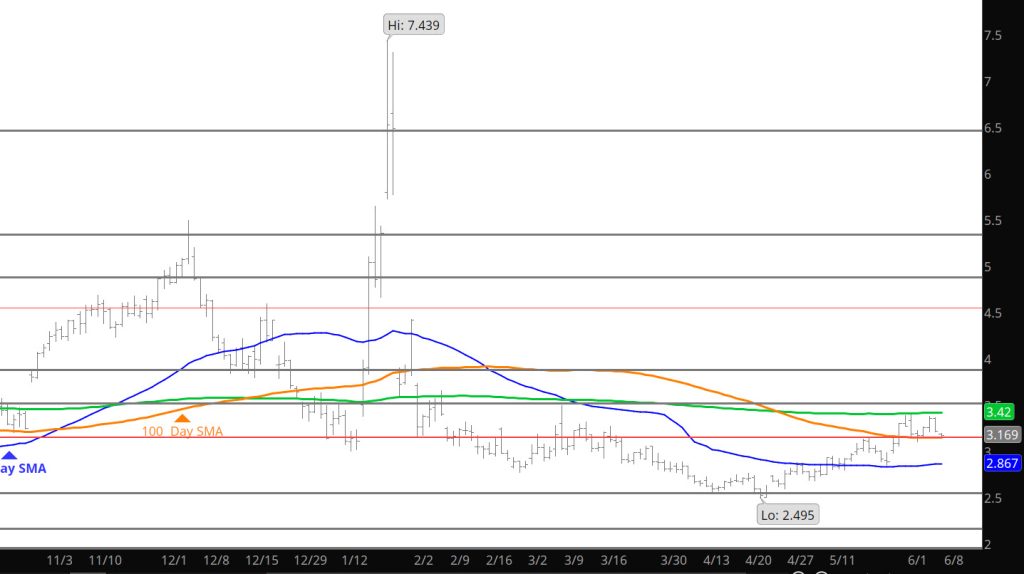
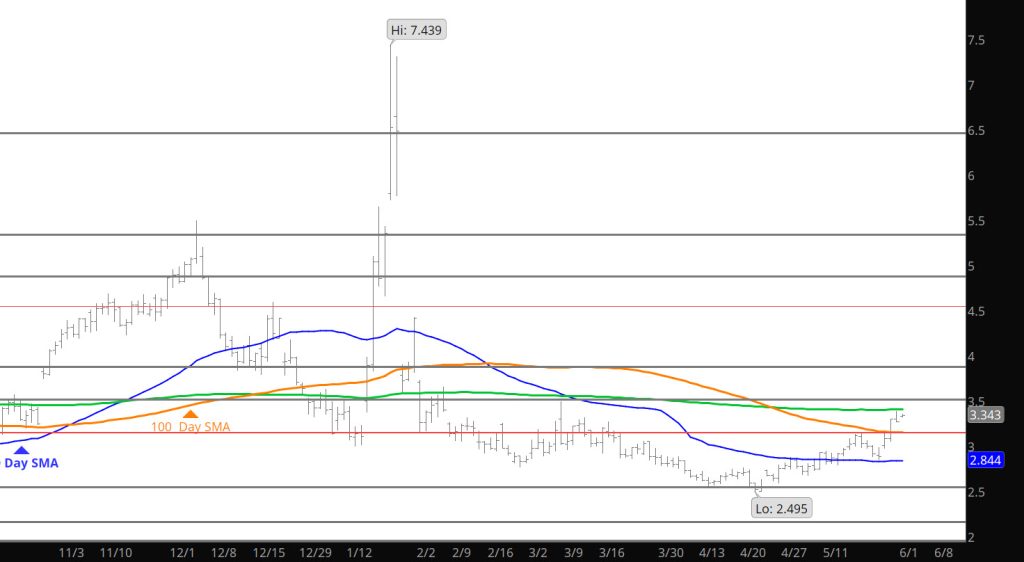
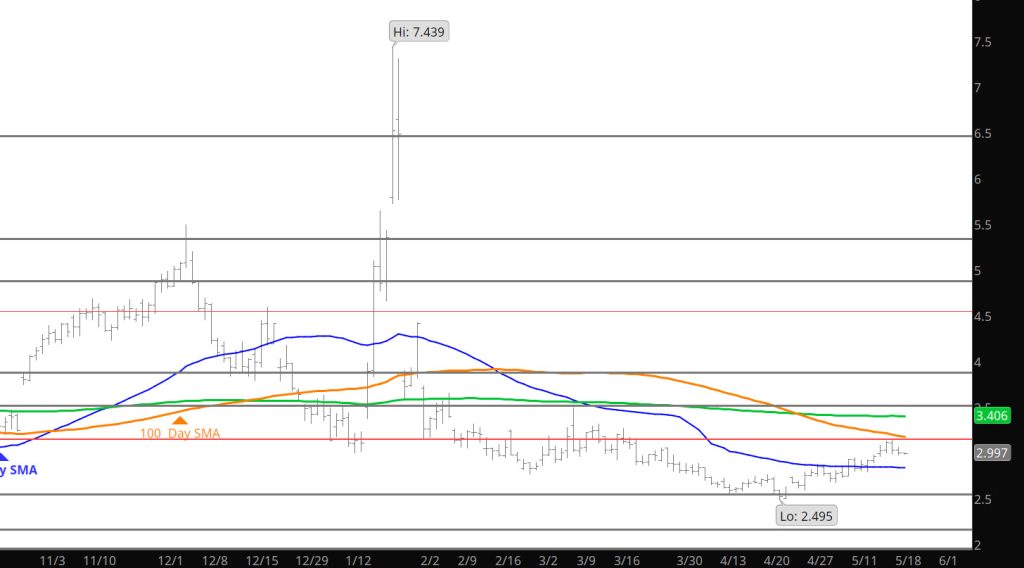
So now we sit at the initial low end of the range– I am expecting a push down to the $3.00-$3.10 area before we get a strong inclination of the potential break down– out of this range.
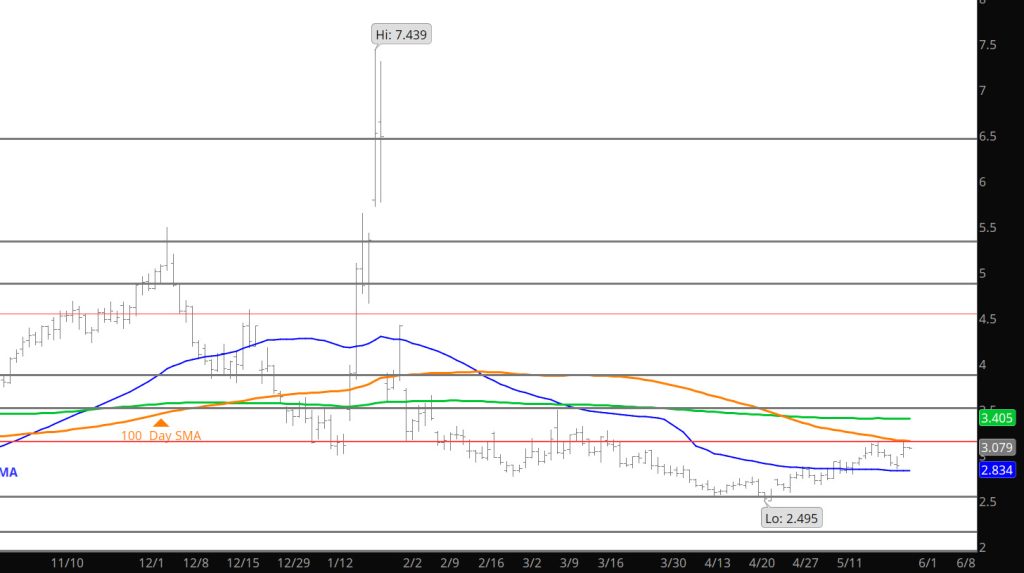
Major Support: $2.640-$2.57 Minor Support/Resistance : $2.87-$2.84,$3.16-$3.148, $3.136, $3.02-$2.97 Major Resistance: $3.35, $3.486-$3.494, $3.567,$ 3.736
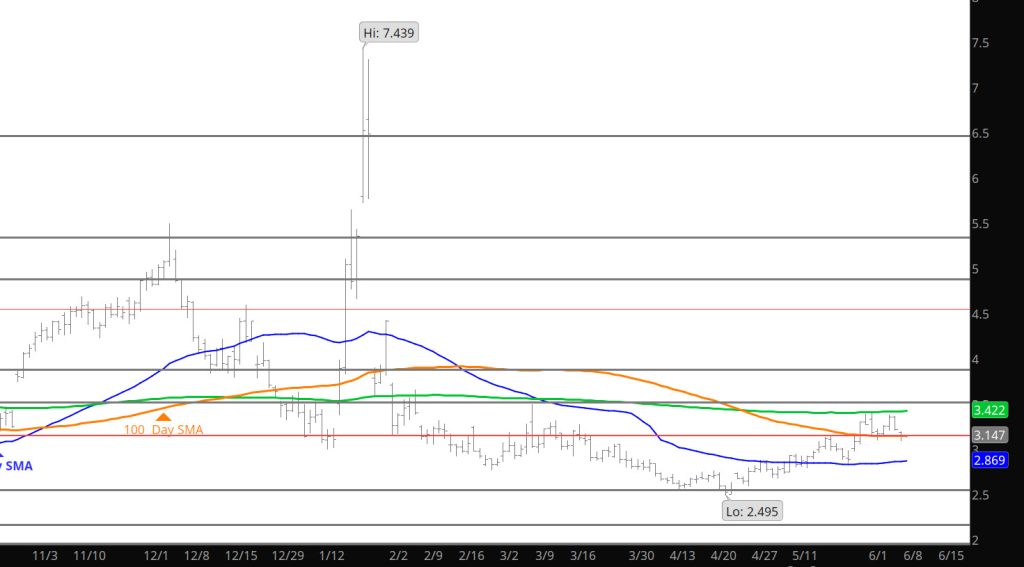
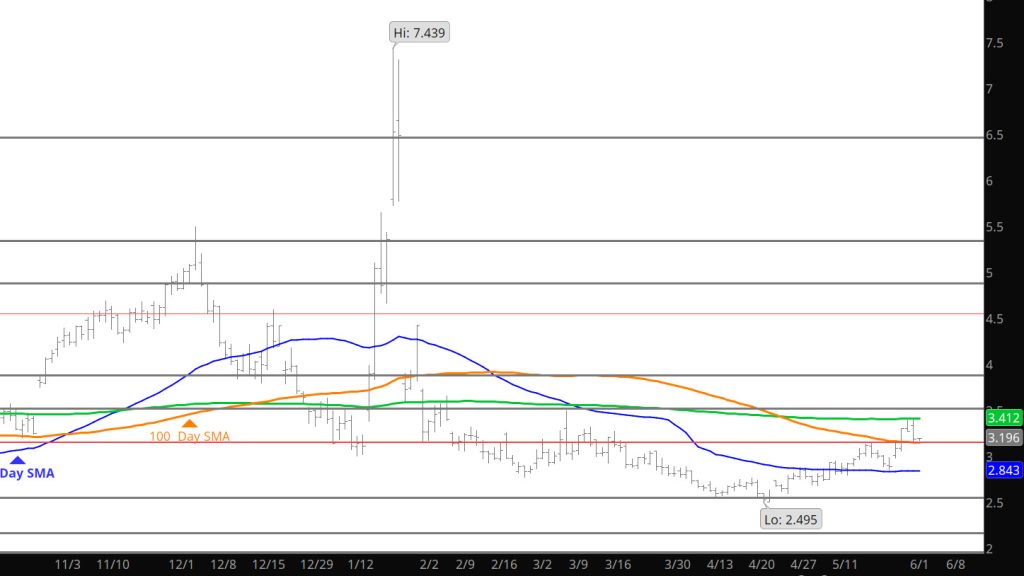
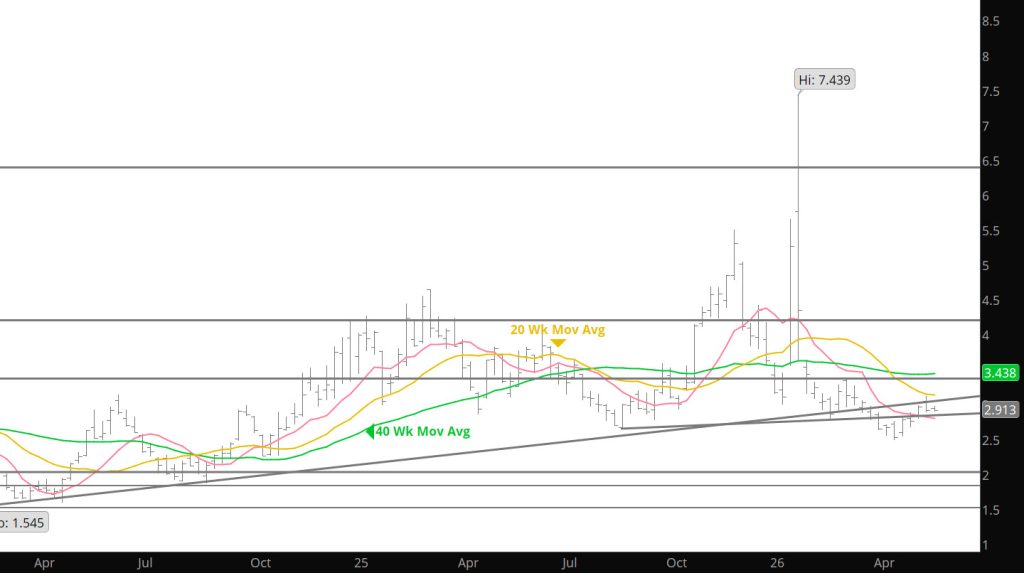
As the chart above indicates, the market has stayed in a tight range for the last eight trading sessions and that include the expiration of the June contract. if you expand support the range goes out to last March. Not sure what will breakout or down from this range — but for now it seems like a good trading environment.
Major Support: $2.640-$2.57 Minor Support/Resistance : $2.87-$2.84,$3.16-$3.148, $3.136, $3.02-$2.97 Major Resistance: $3.35, $3.486-$3.494, $3.567,$ 3.736
Trading last week performed a slightly higher high, $3.396 v $3.388 but again without apparent volume support, July then reversed lower a second time. By mid – day Tuesday July was challenging support (the target zone in support was $3.050 –$3.100,). July traded just into that zone, the low for the week was $3.099. It did so with the lowest volume in nearly a month (the volume requirement works the same way in both directions). Diminishing volume as resistance and then support is tested is characteristic of rangebound trade…unless the gas market can generate more conviction one way or the other, a reasonable guess is that’s what we’ll see for most of June.
Violation of that less than substantial support is likely to lead to a test of the more significant trend line rising from the April/May lows (currently $3.00) and rising a little less than .02/day) providing an opportunity for a low chance to institute for July before another test of the 40 – weeks.
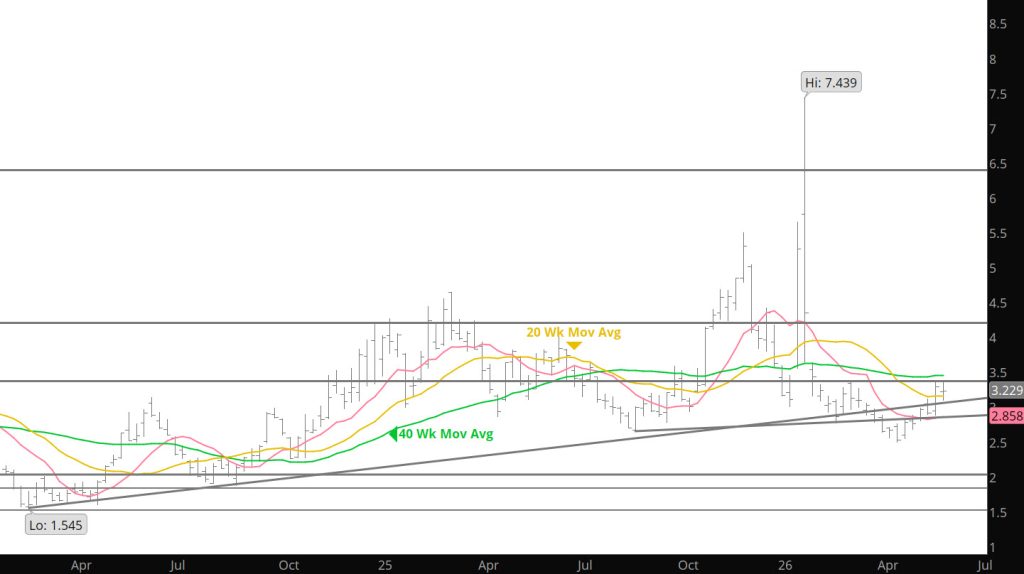
While it has happened before (notably in ’20 when the gas market was in a pronounced downtrend), the first trading day of June is a historically unlikely date for the June high. As previously discussed, over the years the July contract has been more likely to trade its high as prompt either side of 06/15 and in a few cases has been well – bid into contract expiration.
A year ago, prompt gas also traded a March high and an April low, rallied to a pre – Memorial Day high then faded to an 05/29 low (this year that low was 05/27). July ’25 remained range-bound until breaking out on 06/17 and extending its rally to a high on 06/20 ($4.148) before collapsing from the Q2 ’25 high into expiration ($3.261). While a repeat of that collapse should not be totally discounted, this year’s uptrend from the April low is far more orderly than ’25…continue to expect that July settlement will be higher than June ($3.040).
The consensus of technical indicators has now been neutral for fourteen of the last fifteen weeks…this week forfeiting the price positive bias that was earned a week ago. That’s pretty typical for the consensus during the construction of a trading range. A close above the 40 – weeks SMA with supporting volume would trigger positive agreement of the indicators.
Market internals have been mixed for three straight weeks. Average daily volume was lower even though July managed a higher high before falling…higher volume should accompany higher prices if a rally is sustainable. It didn’t and the rally wasn’t.
Major Support: $2.640-$2.57 Minor Support/Resistance : $2.87-$2.84,$3.16-$3.148, $3.136, $3.02-$2.97 Major Resistance: $3.35, $3.486-$3.494, $3.567,$ 3.736
Not a whole bunch of technical analysis off of yesterday’s small rally from support at the 100 day SMA. Stick with the range trade for now, perhaps the storage release will provide the next round of volatility.
Major Support: $2.640-$2.57 Minor Support/Resistance : $2.87-$2.84,$3.16-$3.148, $3.136, $3.02-$2.97 Major Resistance: $3.35, $3.486-$3.494, $3.567,$ 3.736
Discussed the run last week was headed for a test at resistance which it failed at and could not muster the strength to break through. Would expect a test of support, but the question is which support level and will it be another higher low.
Major Support: $2.640-$2.57 Minor Support/Resistance : $2.87-$2.84,$3.16-$3.148, $3.136, $3.02-$2.97 Major Resistance: $3.35, $3.486-$3.494, $3.567, $ 3.736
A couple of technical events occurred last week and are discussed in the Weekly section but the key is the movement last week may set up early trade this week. Would expect prices to test last week’s highs (at or near the 200 day SMA) then the key will be how prices react at that test..
Major Support: $2.640-$2.57 Minor Support/Resistance : $2.87-$2.84,$3.16-$3.148, $3.136, $3.02-$2.97 Major Resistance: $3.35, $3.486-$3.494, $3.567, $ 3.736
June expired with a solid expiration and now July takes its shift as prompt. Same range that has held prices for the last several months. Play the extremes of the range in the coming few days. Lets see how the week closes.
Major Support: $2.640-$2.57 Minor Support/Resistance : $2.87-$2.84,$3.16-$3.148, $3.136, $3.02-$2.97 Major Resistance: $3.35, $3.486-$3.494, $3.567,$ 3.736
As you know, I do not participate in the expiration process due to the light volume and quite often “head fakes” they can provide. I will participate should either end of the range trade enters the target zones whether high or low end with the appropriate trade.
Major Support: $2.640-$2.57 Minor Support/Resistance : $2.87-$2.84,$3.16-$3.148, $3.136, $3.02-$2.97 Major Resistance: $3.35, $3.486-$3.494, $3.567,$ 3.736
Soon to expire June extended its rally to test the continuation 20 – weeks SMA (and its own 20 – weeks average) before reversing lower from an historically consistent mid – May pre Memorial Day high. In eight of the last ten years that short – term seasonal high traded between the 12th and 23rd. Last year the pre – holiday high printed on the 12th (Memorial Day was the 26th) this year on the 20th (Memorial Day is on the 25th. A lower weekly close…after opening above last week’s high ($2.994 v $2.982) with a volume increase (average daily volume increased nearly 70,000 contracts) and a closing short – term uptrend violation indicates that prompt gas will be offered lower before going off the board on Wednesday. Following June expiration the new prompt almost always falls toward a late May/early June low before a rally (which more often than not peaks either side of 06/15 and can be, historically, more often than not the Q2 high.
There is little reason not to believe that prompt gas is likely to continue to adhere to seasonal patterns/tendencies as it has since the blowoff into February expiration. It has been suggested that gas is in the process of constructing a trading range between +/- $2.50 and $3.25 – $3.50 and may continue for much of the remainder of ’26. Gas may test either side of that range while premiums awarded to deferred and distant deferred contracts diminish.
As discussed in the Weekly section earlier this week, the historical trend of weakness around the holiday may effect the trade today.
Major Support: $2.640-$2.57 Minor Support/Resistance : $2.87-$2.84,$3.16-$3.148, $3.136, $3.02-$2.97 Major Resistance: $3.35, $3.486-$3.494, $3.567,$ 3.736