Weekly Consolidation Continues

Weekly Continuation

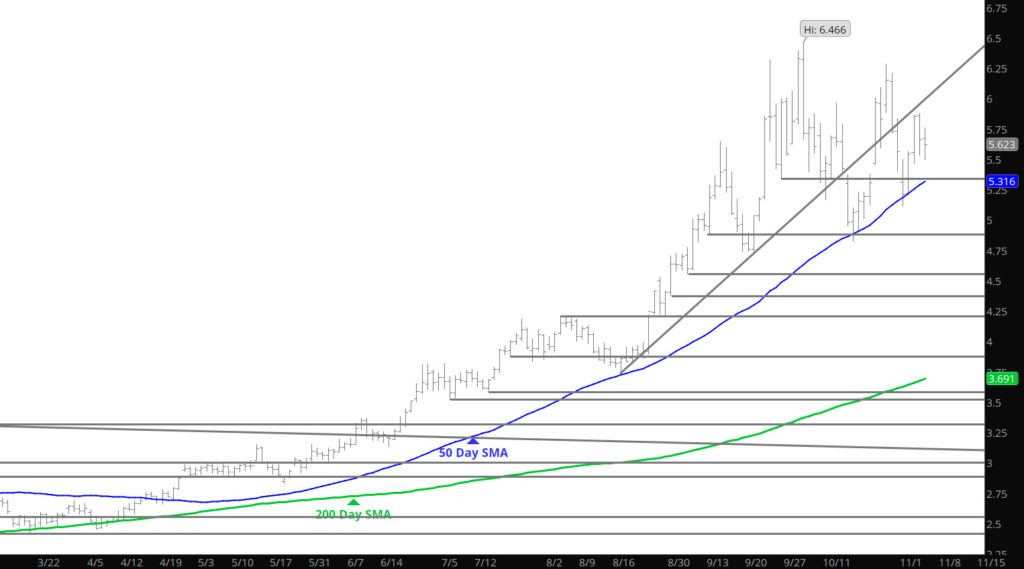
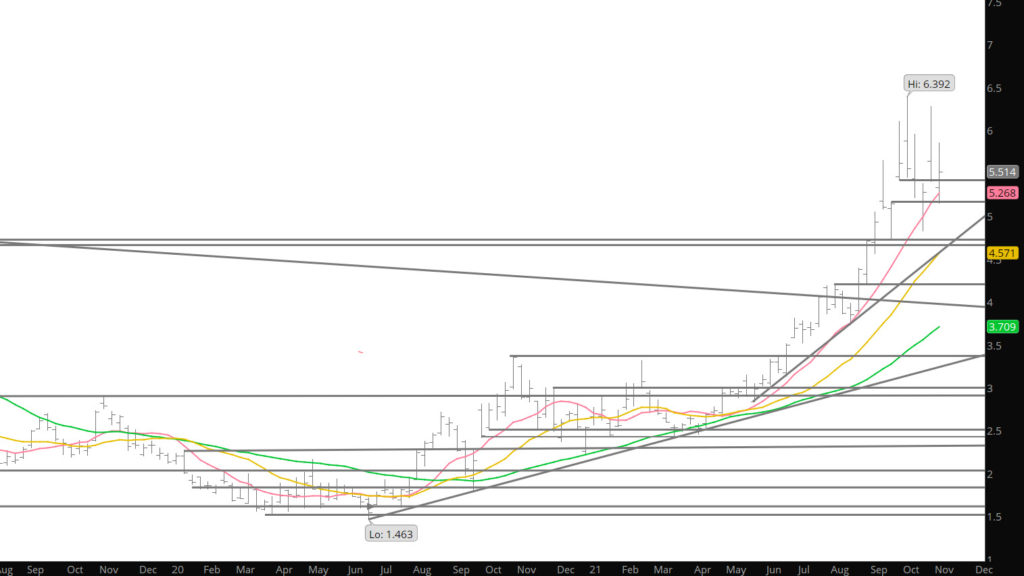
Price action continued in the recent month testing the commonly traded Moving Averages as well as adding to the support between +/- $5.15 and $5.20, the trend line rising from the September and October lows of December gas ($5.165 during the past week, $5.213 for the coming week). Following the successful test of the trend line and moving average support prompt December rallied to trade as high as $5.876 before fading to end the week almost exactly mid-way between the week’s low and high ($5.516 v $5.4955).

The wide weekly ranges that have resulted in higher lows and lower highs and the series of relatively “tight” weekly closes are consistent with the construction of a technical pennant which can construed as part of a continuation pattern– unless/until prompt gas trades through and closes below the last significant higher low. This week for the first time in nine weeks total open interest ,which had declined from 1,468,636 in mid – September to 1,267,227 this past Tuesday, increased. Declining volume and open interest is consistent with a period of price consolidation. Increases in both will be indicative of impending resolution of the consolidation. That will be the key to the upcoming resolution of the month long consolidation.

To read The Daily Call you must be a subscriber (Current members sign in here. )

Funky Action in Natty

Daily Continuation

Nothing should surprise me in trading Natural Gas after 30 years but some things occur that leave me scratching my head (it is bald now). Prices run up $.14 after the outcry close on Friday and I assume it to be related to some forecast change. Then prices open Sunday night and give it all up– what gives with that. The range trade continues and should be profitable outside of a breakdown mentioned in the Weekly section.

To read The Daily Call you must be a subscriber (Current members sign in here. )

Subtle Day
Daily Continuation

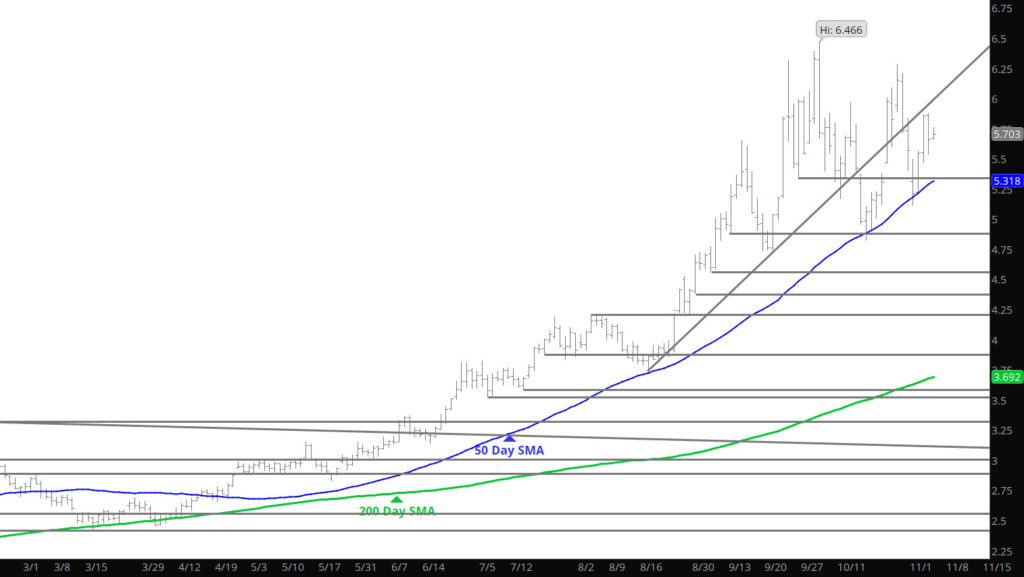
Yesterday, gave us some volatility calmness compared to recent days. No directional bias was established on the storage release. Continue to work the ranges of the last month and this will likely be the trade until the winter in the U.S. and Europe becomes better defined.

Major Support: $5.275, $5.17, $4.88-$4.825, $4.61, $4.537,$4.375, $4.211, $4.156, $3.92
Minor Support: $4.728-$4.70, $4.66
Major Resistance
:$5.64, $5.964, $5.996,$6.177, $6.24-$6.493

To read The Daily Call you must be a subscriber (Current members sign in here. )

Volatility Returns To the Upside
Daily Continuous

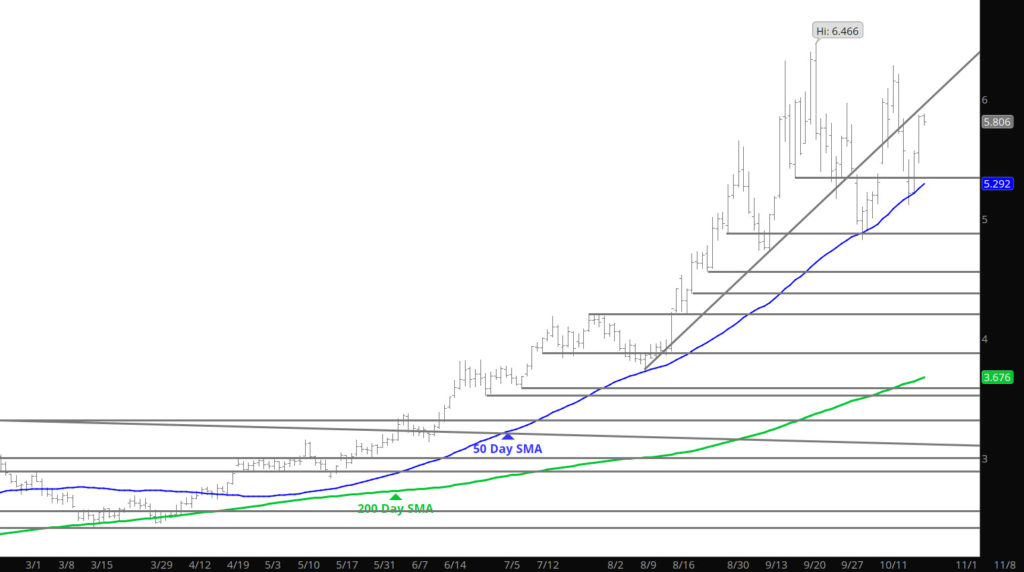
After a large decline on Monday, testing support, prices have now recorded a greater than $.70 gain in the last two days. Though volatility has been part of the trade in recent months, don’t expect any changes in the coming months until the winter has been decided. Continue to work the ranges even after the out cry market plays as prices gained $.16 after the 2:30 pm New York close.

Major Support: $5.275, $5.17, $4.88-$4.825, $4.61, $4.537,$4.375, $4.211, $4.156, $3.92
Minor Support: $4.728-$4.70, $4.66
Major Resistance
:$5.64, $5.964, $5.996,$6.177, $6.24-$6.493

To read The Daily Call you must be a subscriber (Current members sign in here. )

Continuous Range Remains
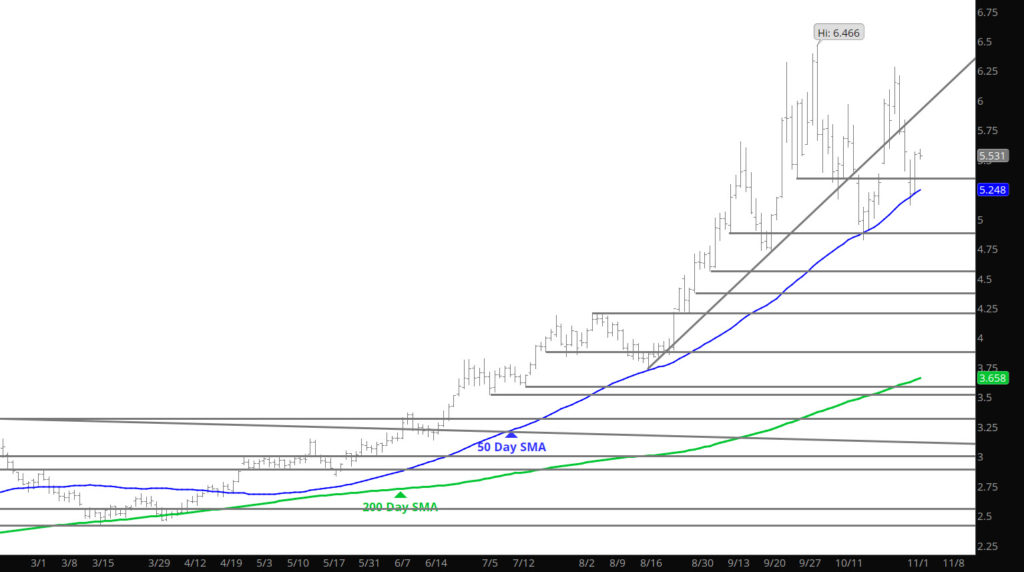
Daily Continuous

The range that started last month continues into this month. Last month’s low was not severely tested before prices started to rebound. The interesting aspect of the range trade is does it test the resistance near $6.00 or above. Unfortunately, there is no technical indication of expansion beyond resistance, nor is there indications that prices will retreat again.

Major Support: $5.275, $5.17, $4.88-$4.825, $4.61, $4.537,$4.375, $4.211, $4.156, $3.92
Minor Support: $4.728-$4.70, $4.66
Major Resistance
:$5.47, $5.568, $5.96, $6.00

To read The Daily Call you must be a subscriber (Current members sign in here. )

Commonly Watched Support Holds
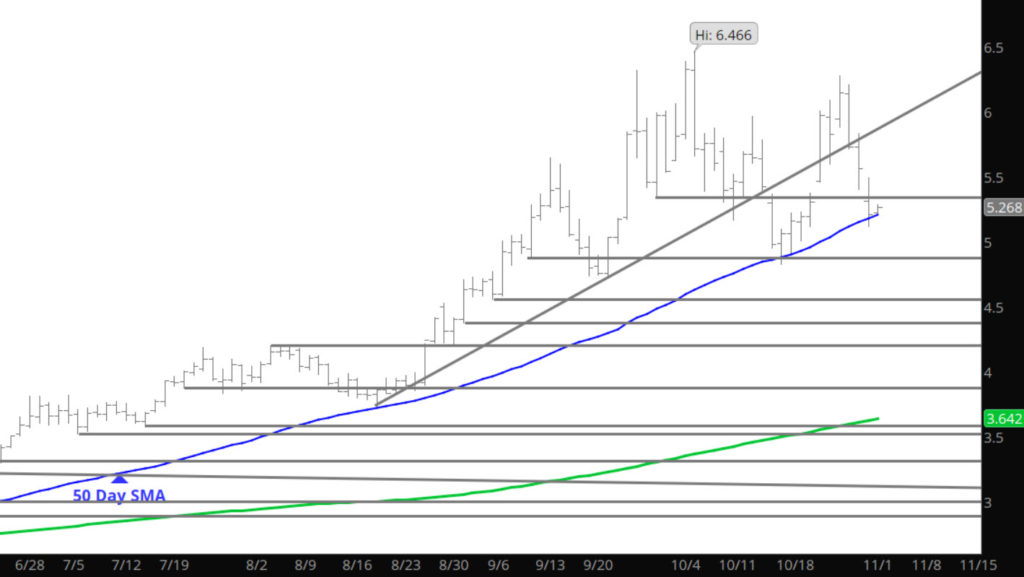
Daily Continuation

This analyst rarely uses the moving averages as an analytical tool in technical analysis, but it is a fact that many trading firms use averages in their algorithms. Due to this well known trait — it is not surprising that the 50 Day SMA received support yesterday, just as it did in August and October when challenged. What is more important is the movement after the test — does the market realize the test is a necessary part of developing a base or the initial movement in a collapse of the rally. Seems like a low risk opportunity to add length with tight stops.

Major Support: $5.275, $5.17, $4.88-$4.825, $4.61, $4.537,$4.375, $4.211, $4.156, $3.92
Minor Support: $4.728-$4.70, $4.66
Major Resistance
:$5.47, $5.568, $5.96, $6.00

To read The Daily Call you must be a subscriber (Current members sign in here. )

Sunday Night Closes Gap
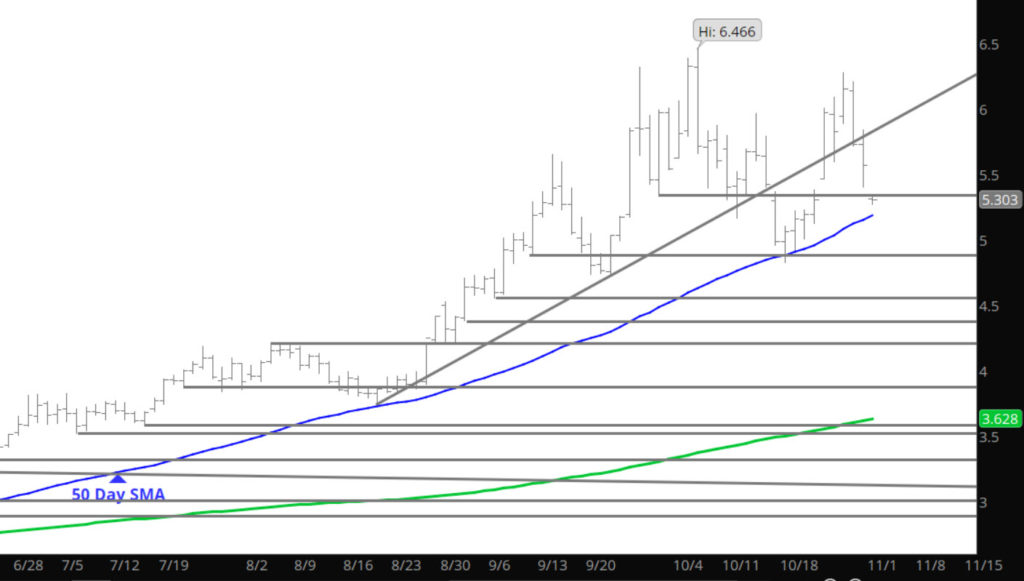
Daily Continuation

The small gap left from last week on the Daily and Weekly charts (last Monday opening) started to be closed last Friday and now has been closed in the early trade on Sunday night. From here, extensions to support zones should continue during the upcoming week. Though the declines have been startling the market has still not traded to a lower low (discussed in the Weekly) and remains in the current (one year plus) bias.

Major Support: $5.275, $5.17, $4.88-$4.825, $4.61, $4.537,$4.375, $4.211, $4.156, $3.92
Minor Support: $5.489, $4.728-$4.70, $4.66
Major Resistance
:$5.47, $5.568, $5.96, $6.00

To read The Daily Call you must be a subscriber (Current members sign in here. )

December Breaks Lower Tests Nov Support
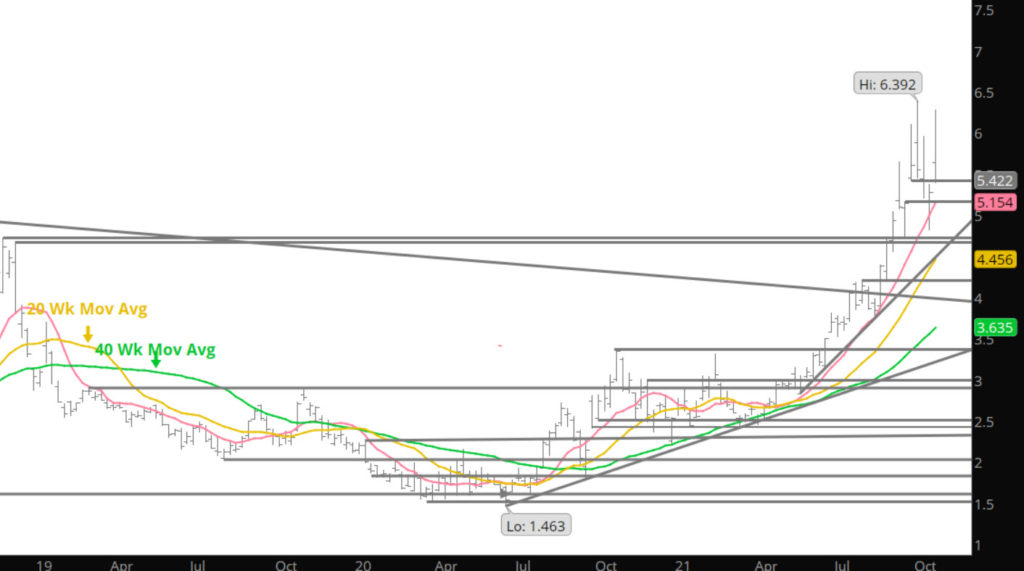
Weekly Continuation

November was the eighth straight monthly contract to rally into expiration and settlement, the highest settlement since December ’08 went off at 6.888, was the eighth consecutive higher than the immediately preceding month. After last week’s gap lower (5.379 – 5.400) this week’s gap higher ($5.379 – $5.462narrowed on Friday to $5.379 – $5.400) left a rare “island” reversal. Expect that gap to be closed this week. The market hasn’t seen one of those since the November ’19 high. Whether this “island” survives or not, the current conditions that led to its occurrence are significant technical factors similar to what they were nearly two years ago.

During calendar October prompt (Nov) gas defined or perhaps more reconfirmed old support and resistance levels. Both the September and October highs were within a zone of resistance between the January ’09 and February ’14 highs, the October ’21 low between highs traded during Q4 ’18. Still, within that wide area prompt gas continued the more than a year-old pattern of trading higher lows and higher highs (discussed in the fall of 2020 and re-confirmed this past summer at Ecom) the primary characteristics of an uptrend. Unless and until that pattern is broken and the support zone between the September and October lows ($4.825 –$4.735, the last higher low) the technical assumption is that the uptrend will continue to higher highs.

To read The Daily Call you must be a subscriber (Current members sign in here. )

What Goes Up May Come Down
Daily Continuation

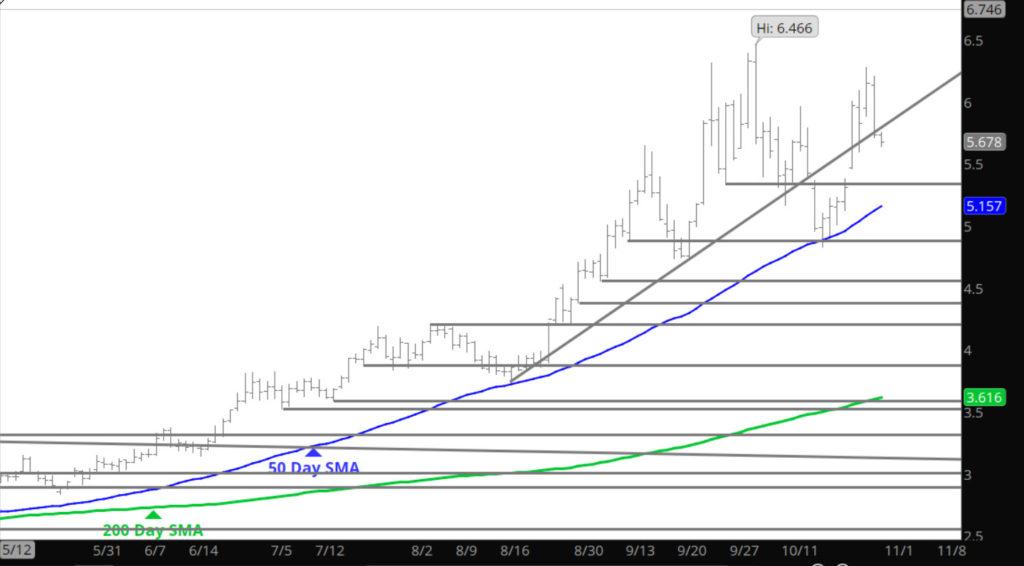
December started off as prompt with declines back below the $6.00 level. Not sure of the reasons for prices having issues with the $6.00 level, but it is clear that the market is not comfortable with prices remaining above that level for extended periods of time. Trade should respect this issue near term or until the trend and behavior changes. The general range has not changed from last month from $5.30 to $6.00.

Major Support:$5.655, $5.275, $5.17, $4.88-$4.825, $4.61, $4.537,$4.375, $4.211, $4.156, $3.92
Minor Support: $5.489, $4.728-$4.70, $4.66
Major Resistance
: $6.008, $6.24-$6.493, $6.28,$6.466

To read The Daily Call you must be a subscriber (Current members sign in here. )

Nothing New — Prices Strong Through Expiration
Daily Continuation

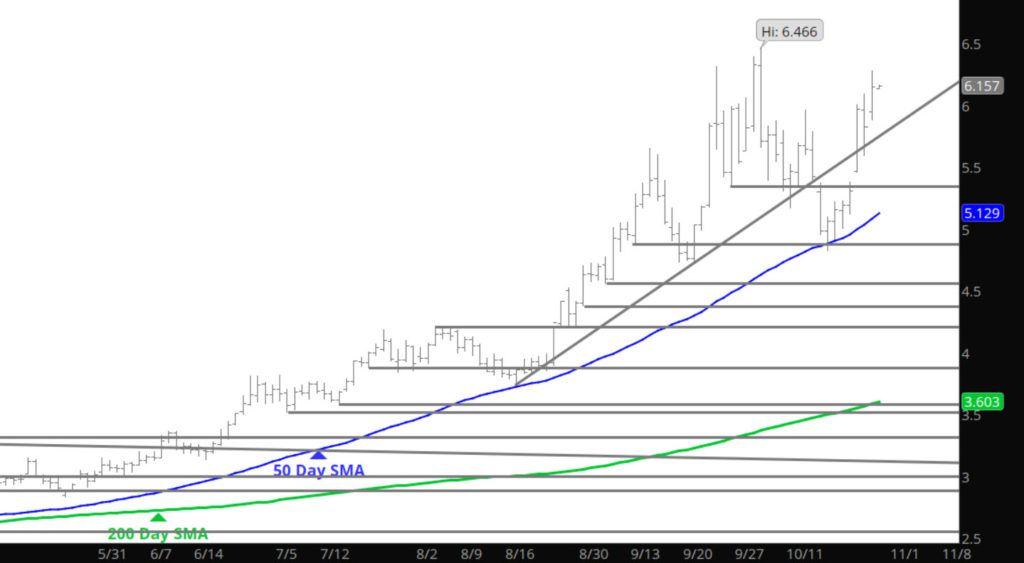
For the eight consecutive month, expiration was met with strength in prices. So strong was the Nov expiration that it the price drove through the Dec price that now takes over as prompt. Now prices sit over the $6.00 threshold which seemed to present problems during the previous runs. All during the excitement in October, there was only one daily close above $6.00. How does this strength play out. Look to add to length on retracement– if your shorting this market for longer trade positions — re-evaluate strategy– there is not technical indication that this strength (longer term) is abating.

Major Support:$5.82, $5.655, $5.275, $5.17, $4.88-$4.825, $4.61, $4.537,$4.375, $4.211, $4.156, $3.92
Minor Support: $5.489, $4.728-$4.70, $4.66
Major Resistance
$6.24-$6.493, $6.28,$6.466

To read The Daily Call you must be a subscriber (Current members sign in here. )