New Lows — Good Luck

Daily Continuous

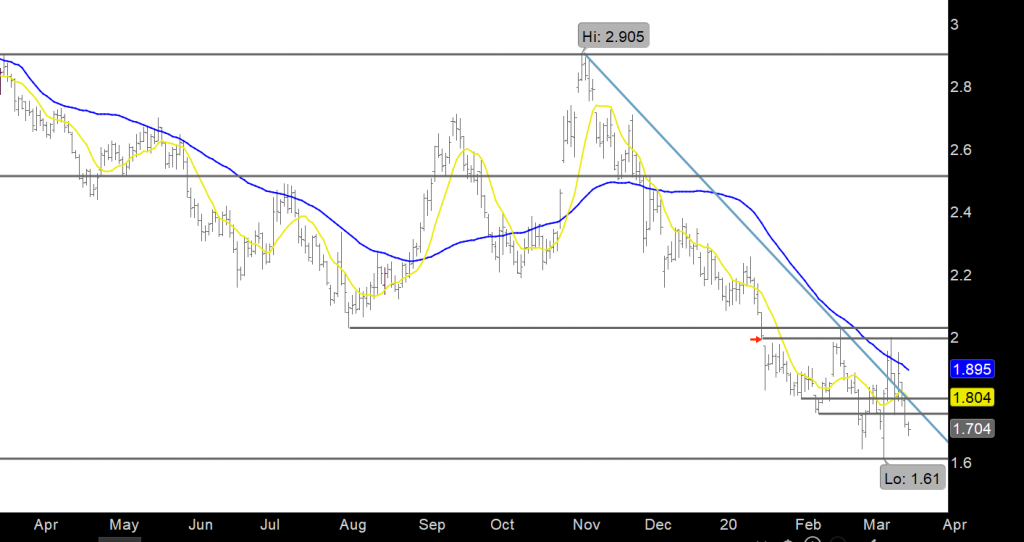
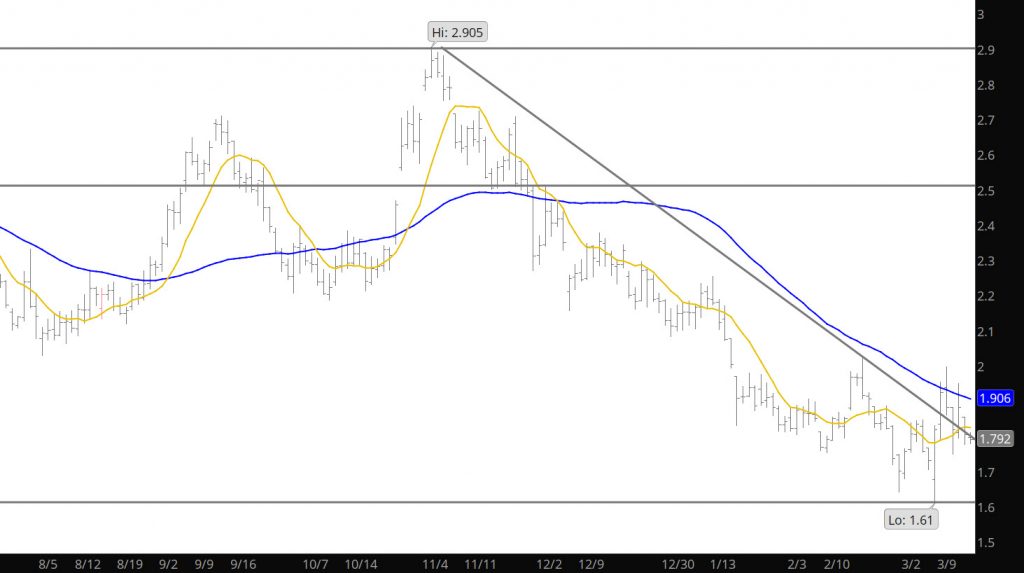
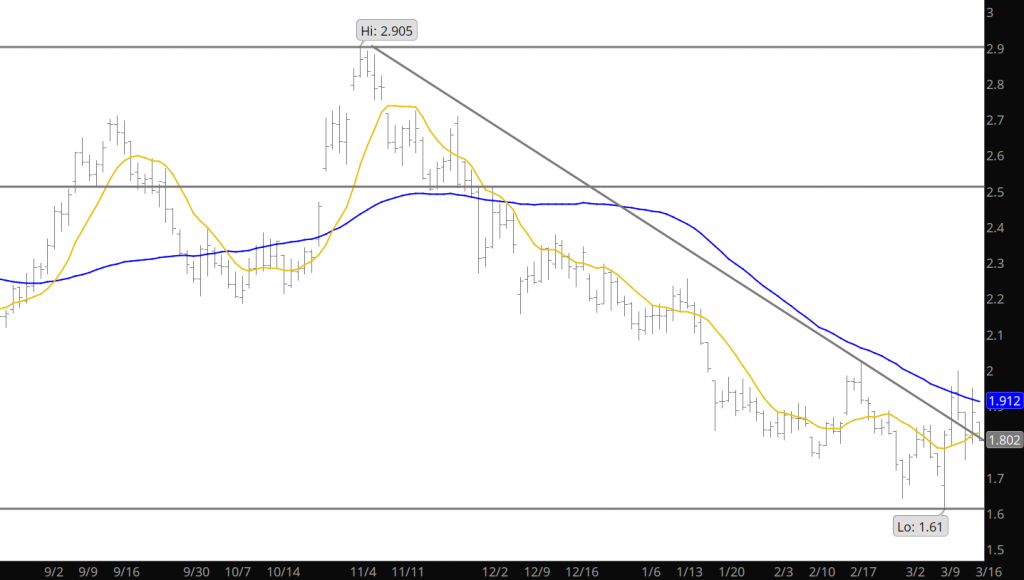
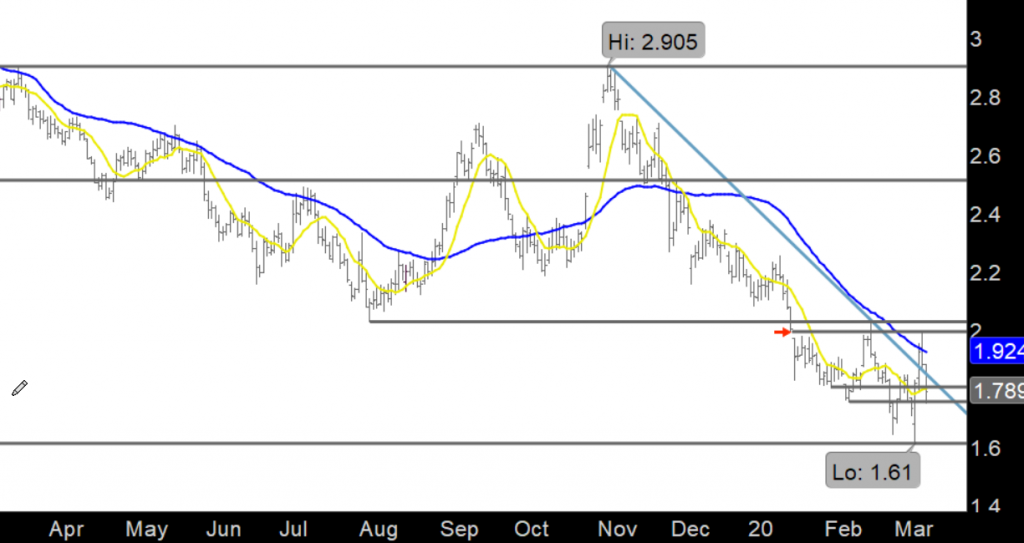
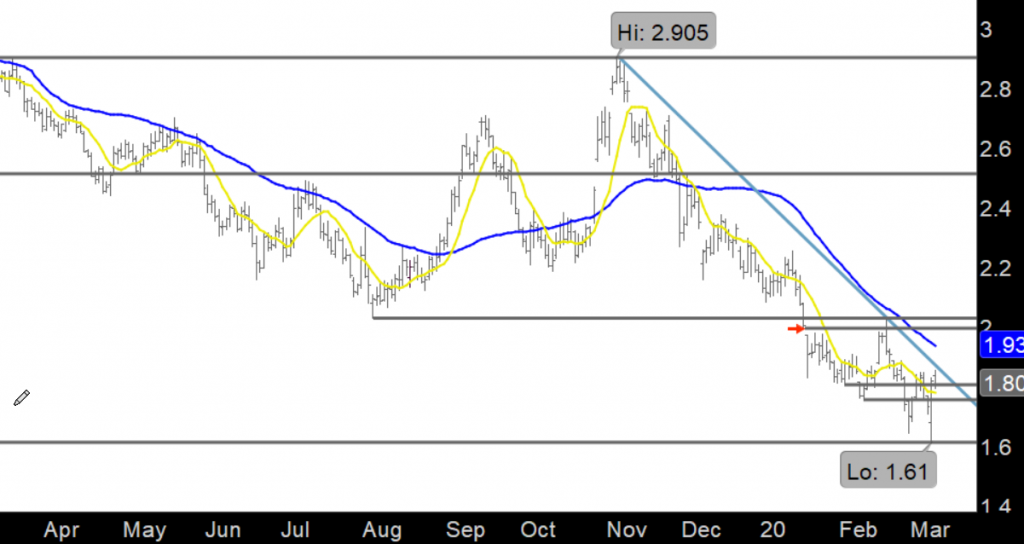
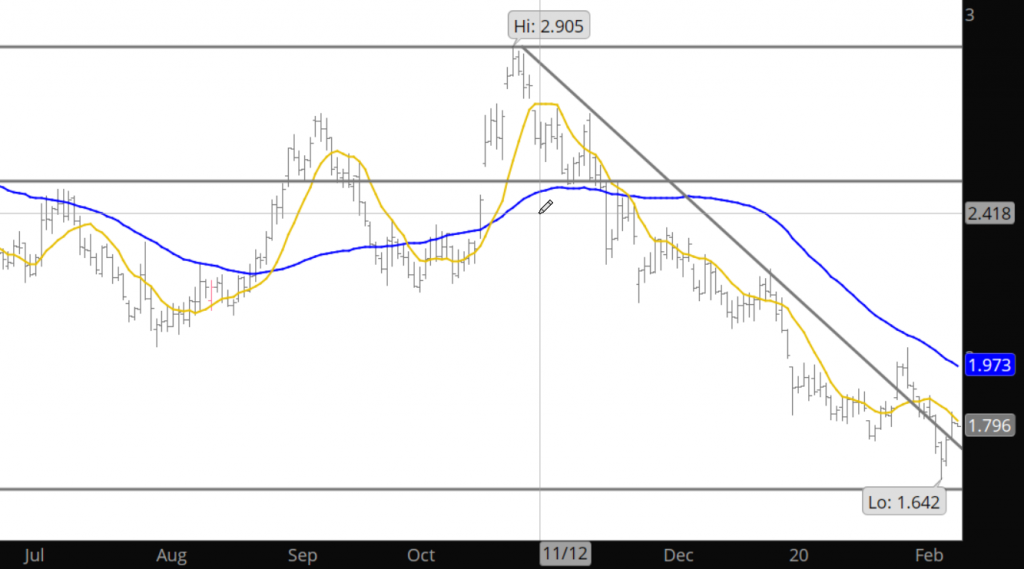
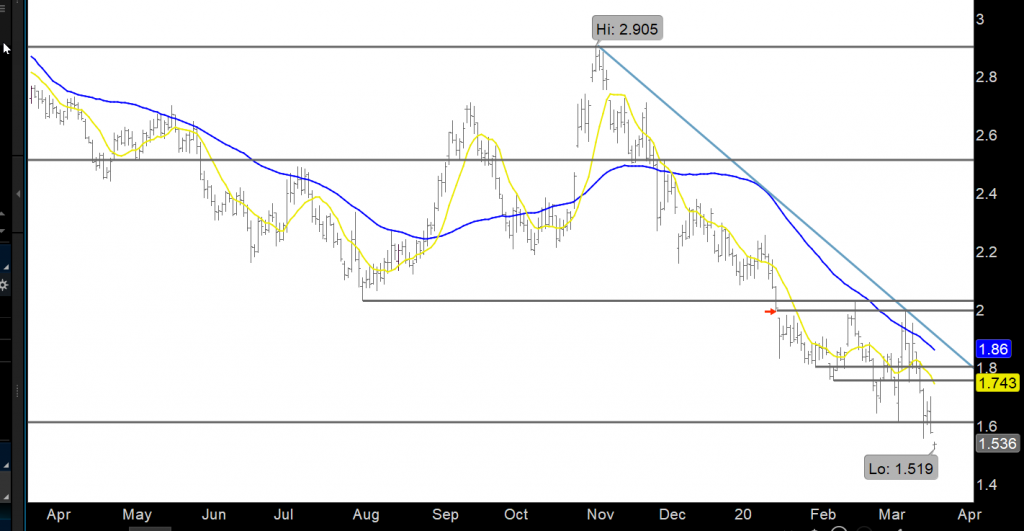
The bears are growling along now as prices closed the week below the long held support for the last few years. Having heard from many of them over the weeks it will be fun to watch the outcome. Technically, good luck and pick a number — any number — I am buying length in certain increments after playing the range for the last three months.

Range Continues — Expect a Test of Support

Daily Continuous

Have been issuing suggestions of playing the range for the last two months and the range has remained between $1.61ish and $2.00ish. That has remained a profitable 20+% range with which to derive revenues if you are a trader. Some fundamental folks don’t understand that trading is different than “a low versus a top”. The bell is not going to ring when the low occurs and everyone jumps in. As discussed on the pay site, this is not likely to be a violent reversal to a bull market, but rather one of tests and steps. Until the break out occurs, play the range.

HUH, Commodities Creamed, Gas Down Little

Daily Continuous

Major Support: $1.611
Major Resistance: $1.99, $2.029, $2.08-$2.10, $2.34, $2.437, $2.48-$2.52,
Minor Resistance: $1.883,

Prices were down, as with all commodities, but the declines in gas were muted as the support displayed last week continues. Continue to play the range for the near term.

Last Week Damaged the Declines

Daily Continuation

Major Support: $1.611
Major Resistance: $1.99, $2.029, $2.08-$2.10, $2.34, $2.437, $2.48-$2.52,
Minor Resistance: $1.883,

Last week looked calm from the trade range standpoint, as prices closed the week higher. However, it was a classic outside week reversal for natural gas on significantly higher volume after prices tested the lows (failing to extend lower) from numerous years (discussed on the website). While the range is intact for day trading, it is time start being aware of the issue that the market may be changing its stripes.

Right On Que Major Resistance Tested

Daily Continuous

Major Support: $1.611
Major Resistance: $1.98, $2.029, $2.08-$2.10, $2.34, $2.437, $2.48-$2.52,
Minor Resistance: $1.883,

This range is working out very well for some incremental revenue but eventually it will break — one way or the other.  Look for a test of support now that prices rallied $.30 , only to be rejected at resistance. Until then trade the range and garner some light profits.

Major Support Tested

Daily Continuation

Major Support: $1.611
Major Resistance: $1.98, $2.029, $2.08-$2.10, $2.34, $2.437, $2.48-$2.52,
Minor Resistance: $1.883,

Over the night, prices tested major support from various years and then rallied off those lows. As explained yesterday, continue to work the range and let the prices trade the range until information changes.

Prices Testing Major Support

Daily Continuation

Major Support: $1.611
Major Resistance: $1.98, $2.029, $2.08-$2.10, $2.34, $2.437, $2.48-$2.52,
Minor Resistance: $1.883,

Prices are testing the support from numerous years between 1996 through 1999 and ’10, ’15, and ’16. Have no clue what will happen with all the outside interference from crude and the virus. Will be interesting to witness how the market reacts. From trade perspective, buy support and sell the resistance.

Excitement Reins

Major Support: $1.611
Major Resistance: $1.98, $2.029, $2.08-$2.10, $2.34, $2.437, $2.48-$2.52,
Minor Resistance: $1.883,

Excitement rules the market as price fell on the storage release. I am neither bullish nor bearish on Nat Gas as the volatility in the stock market has focused my interests.  Remember, I am a trader — I want volatility and Nat Gas is not bringing it on yet. So now we sit chasing the low end of the recent range — think as a trader, I will be buying dips into the $1.60’s — Duh.  Does it get down to the lows from 2016 at $1.611 — no clue as it has been bought well before, recently. What happens if it dips below that support— Where is the gas market headed —- OOOOHHHH My. 

Quiet Day on the Farm

Major Support: 1.611
Major Resistance: $1.98, $2.029,$2.08-$2.10

Well that Daily got some comments and some of you sent links trying to explain why the market was finding support — Thank you for your efforts. I believe that he market is finding support, just as it has every year, as the results of winter end and summer begins during the second quarter. Again, I do not follow supply and demand, but believe that supply and demand is interpreted in the price action. It seems that the balance may be coming tighter and that is why prices are finding muted support. Close above the 10 day average (big whoopie) but this support and resistance test game is far from over.

Where Did the Buying Come From

Daily Continuous Chart

Major Support: $1.611
Major Resistance: $1.98, $2.029,$2.08-$2.10
Minor Resistance: $1.883

What is up with this movement— some of the physical traders are questioning me on why prices are rising.  No clue from the physical perspective as I don’t look or care about storage etc.  Prices are rising so far this week because markets need to test support and resistance and gas is trying to test resistance after testing support last week.  One physical trader said I was way off on 1.7 TCF for ending inventories—— DUH—- that was the low end of expectations (from what I hear) and the reason I sighted it was “who cares”, the weather forecasts and storage ending inventories are built into the market currently. Does 1.7 or 1.9 make any difference to the enormous short position currently in the market. Where do some of you think the current short position came from— (sarcastic rhetorical question).