To read The Daily Call you must be a subscriber (Current members sign in here. ) Start your subscription today.
Author: Willis Bennett
Bias Has Flipped– Expiration Coming
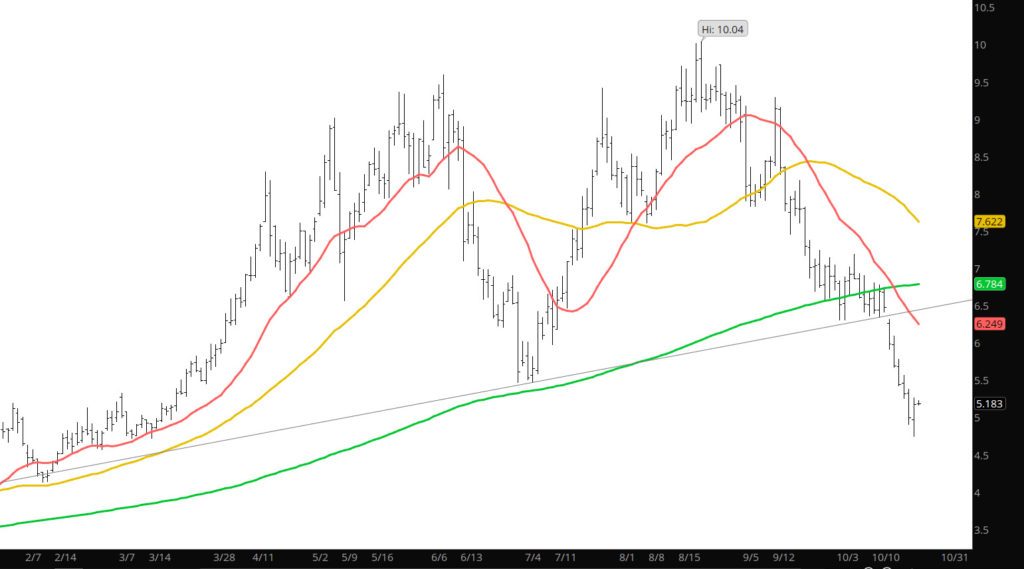
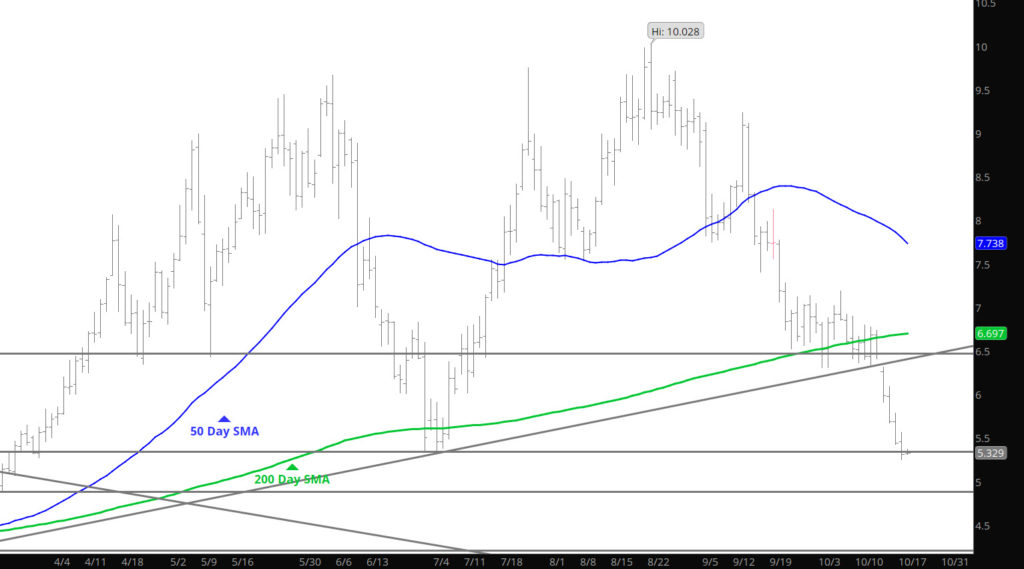
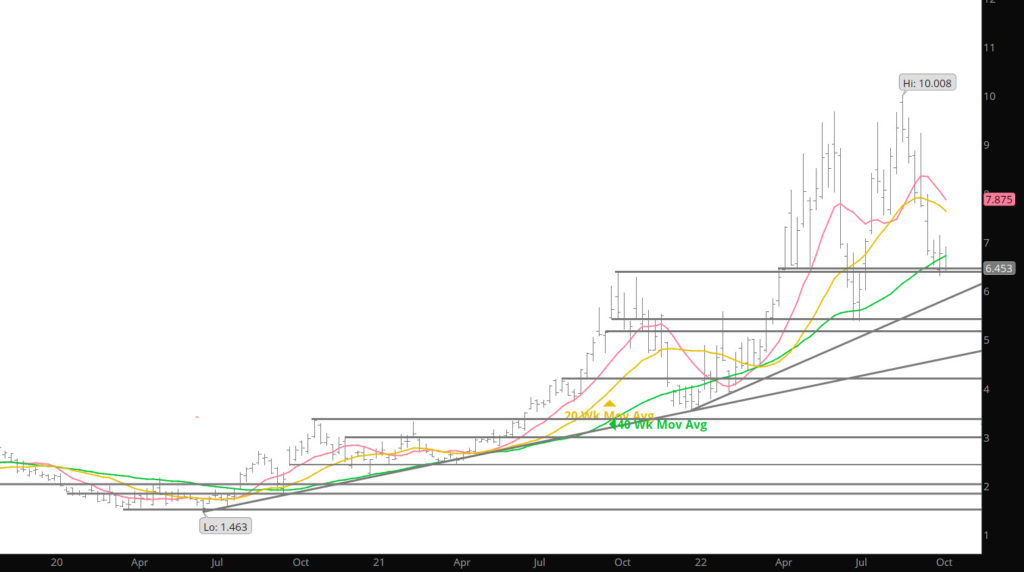
Don’t see how the market could be more bearish — but when at these levels of being oversold (levels on six times in the history of trading — see Weekly section) the market historically taken a breath. What is going to be interesting to this trader is what happens during expiration. We have seen a series of strength month after month but that behavior was modified at the Oct expiration. With all the selling in the last couple of weeks is there a period of strength coming this month — Not sure but that’s why it will be interesting to me.
Major Support: $4.903, $4.716, $4.705-$4.68
Minor Support
Major Resistance:$5.32-$5.37, $6.314, $6.456, $6.74, $7.18, $7.532, $7.71-7.75, 8.021,
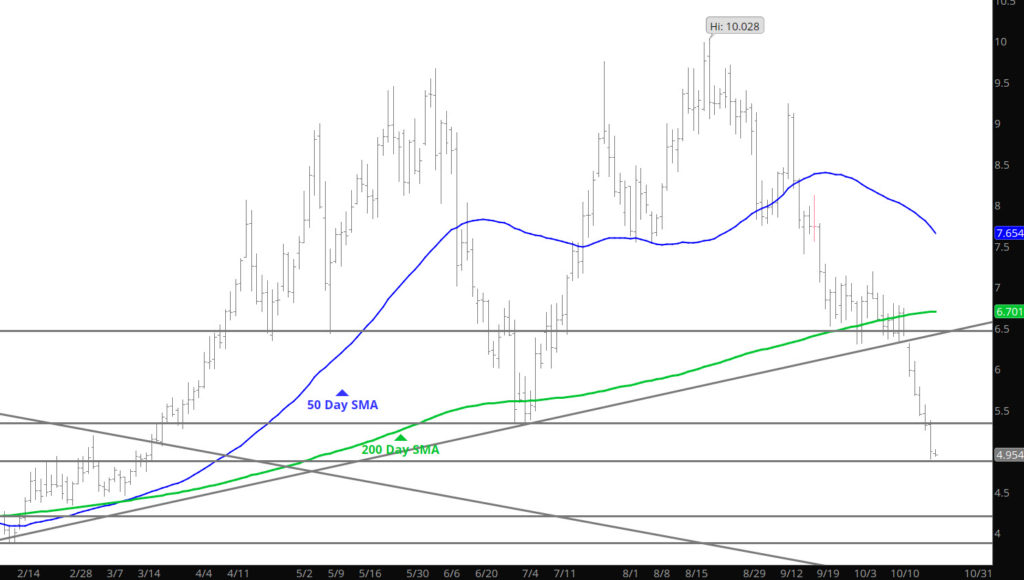
Technical Destruction of 2022 Bull Bias
To read The Daily Call you must be a subscriber (Current members sign in here. ) Start your subscription today.
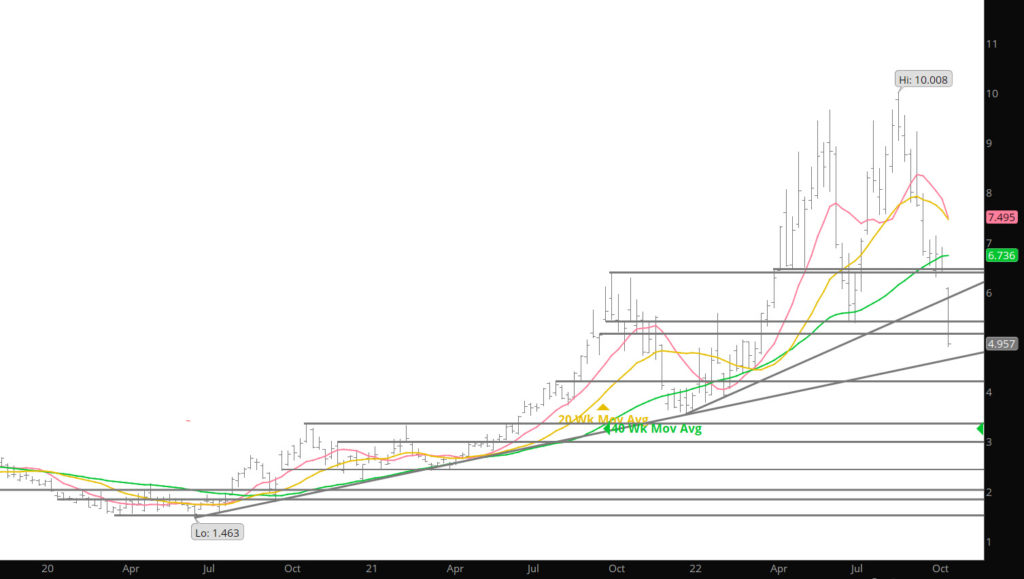
2 Year Bull Market May Be Closing
To read The Daily Call you must be a subscriber (Current members sign in here. ) Start your subscription today.
Perhaps Range Is Defining
To read The Daily Call you must be a subscriber (Current members sign in here. ) Start your subscription today.
Continuing To Define the Low End of Range
To read The Daily Call you must be a subscriber (Current members sign in here. ) Start your subscription today.
Sunday Weakness Confirmed — Huge
To read The Daily Call you must be a subscriber (Current members sign in here. ) Start your subscription today.
Consolidation — Range Trade
To read The Daily Call you must be a subscriber (Current members sign in here. ) Start your subscription today.
Sunday Trade Looks to Expand Low End of Range
To read The Daily Call you must be a subscriber (Current members sign in here. ) Start your subscription today.
High End of Range
To read The Daily Call you must be a subscriber (Current members sign in here. ) Start your subscription today.