To read The Daily Call you must be a subscriber (Current members sign in here. ) Start your subscription today.
Author: Willis Bennett
Close But No Cigar Yet
To read The Daily Call you must be a subscriber (Current members sign in here. ) Start your subscription today.
Bearish Extends Closing Jan Premium Expected
To read The Daily Call you must be a subscriber (Current members sign in here. ) Start your subscription today.
Expiration Gap Closed
To read The Daily Call you must be a subscriber (Current members sign in here. ) Start your subscription today.
Bearish
To read The Daily Call you must be a subscriber (Current members sign in here. ) Start your subscription today.
Pushing Toward Major Support
To read The Daily Call you must be a subscriber (Current members sign in here. ) Start your subscription today.
Press Lower
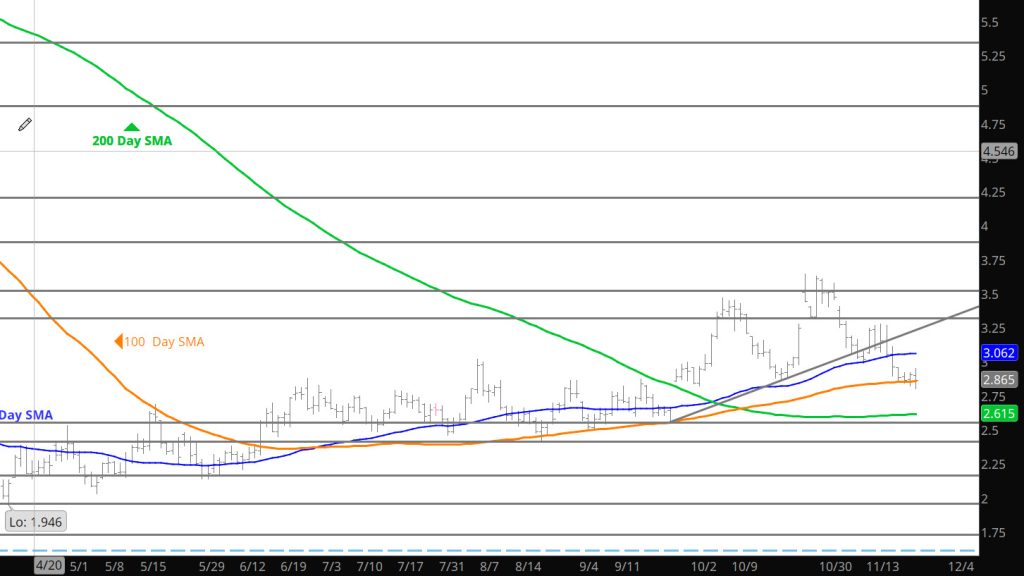
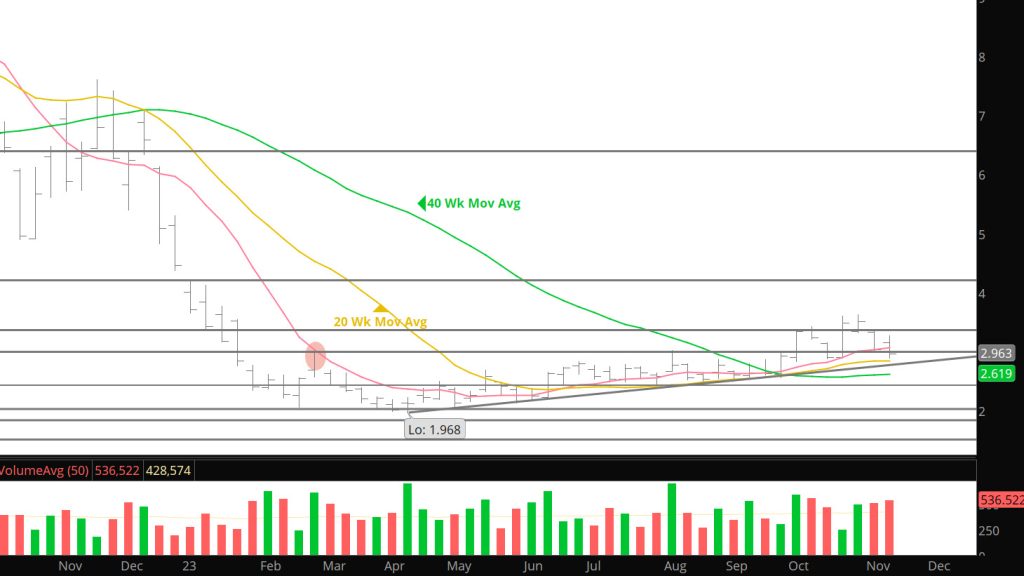
Daily Continuous
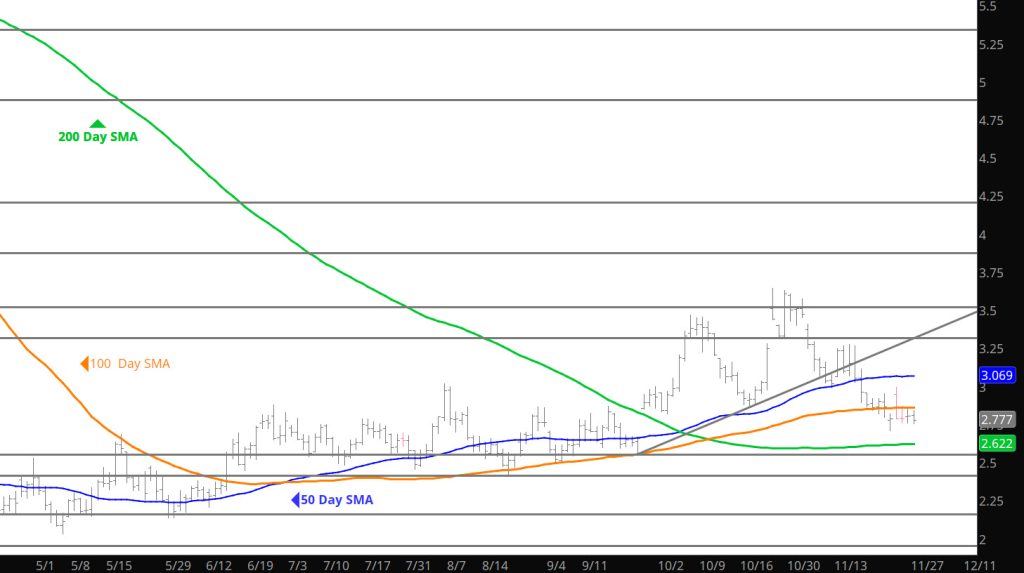
As suggested in the Weekly yesterday, prices pressed lower and are now starting to attract the major support areas from the summer (what was resistance is now support). This will be interesting as volume during the holiday week is historically weak and may make the extending the declines easier.
Major Support: $2.98-$3.03, $2.82-$2.78, $2.74, $2.608, $2.47, $2.00, $1.991-$1.96, $1.795-$1.766
Minor Support $3.16, $2.84, $2.38-$2.26, $2.17
Major Resistance $3.48, $3.536, 3.59, $3.65
Last Week Provides Negative Near Term Bias
To read The Daily Call you must be a subscriber (Current members sign in here. ) Start your subscription today.
Down– But Out???
To read The Daily Call you must be a subscriber (Current members sign in here. ) Start your subscription today.
Storage Report Brought Volatility
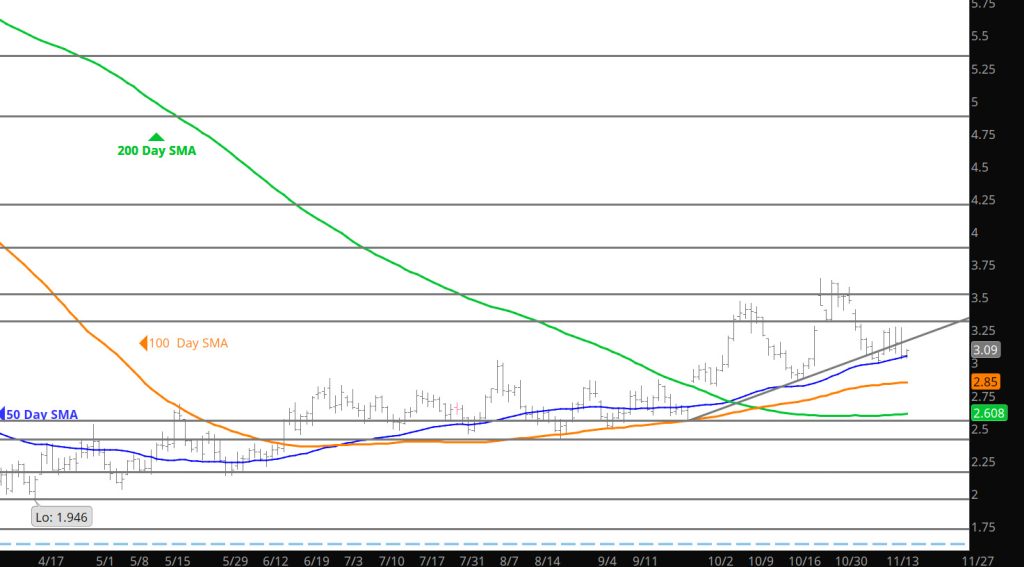
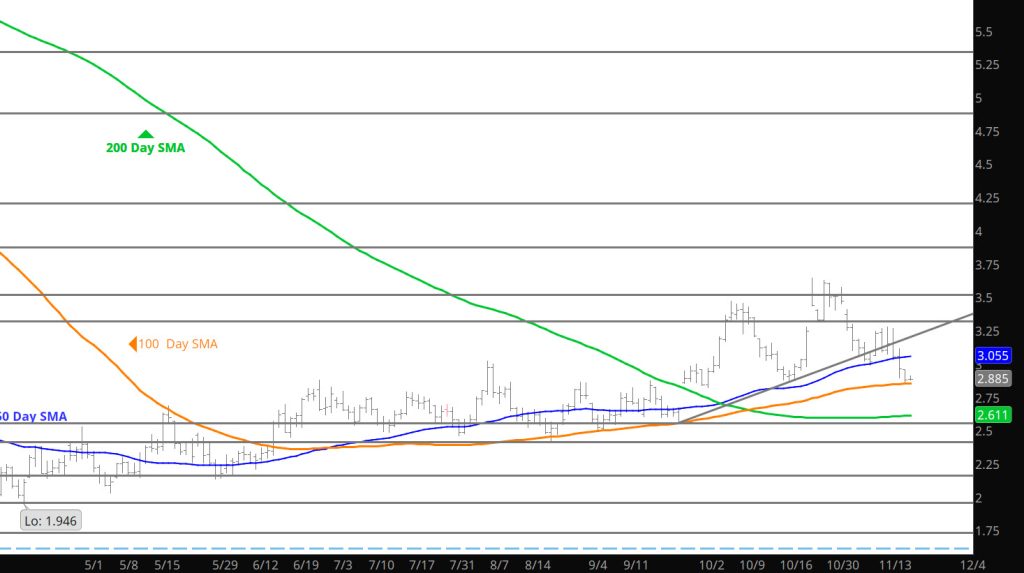
Daily Continuous
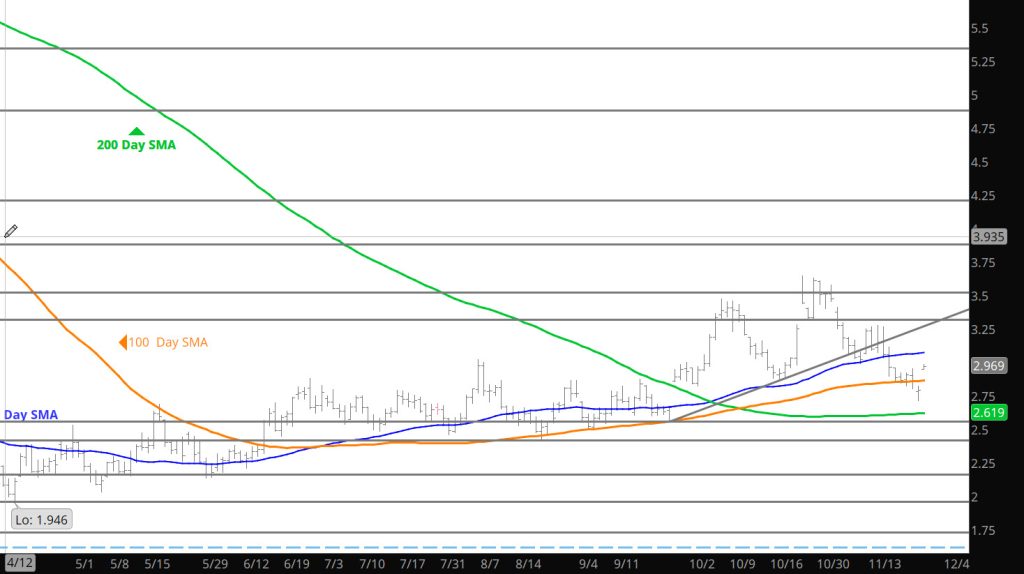
Expected the potential for volatility but a $.238 range yesterday seemed a little over done. Regardless, prices now have to deal with the key $3.00 area that was rebuked last week at the 50 day SMA. So here we sit — if you a bullish bias trader, then buying on this decline with a stop just below the key support zoned makes for a low risk trade. If you are a bearish bias the you need to see a close below the key area to add to positions.
Major Support: $2.98-$3.03, $2.82-$2.78, $2.74, $2.608, $2.47, $2.00, $1.991-$1.96, $1.795-$1.766
Minor Support $3.16, $2.84, $2.38-$2.26, $2.17
Major Resistance $3.48, $3.536, 3.59, $3.65