Don’t Listen To Technical Issues — Keep Selling

Daily Continuous

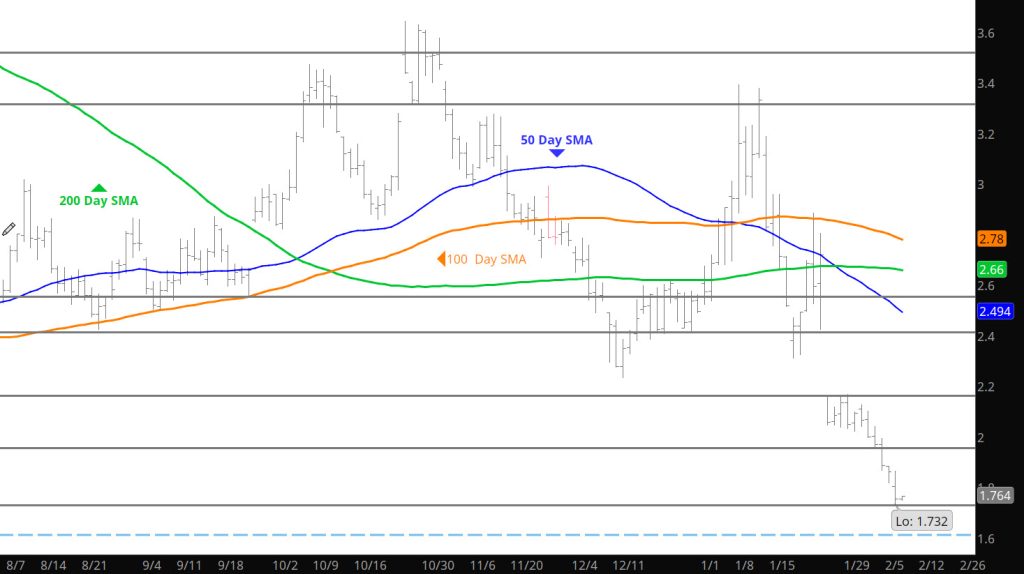
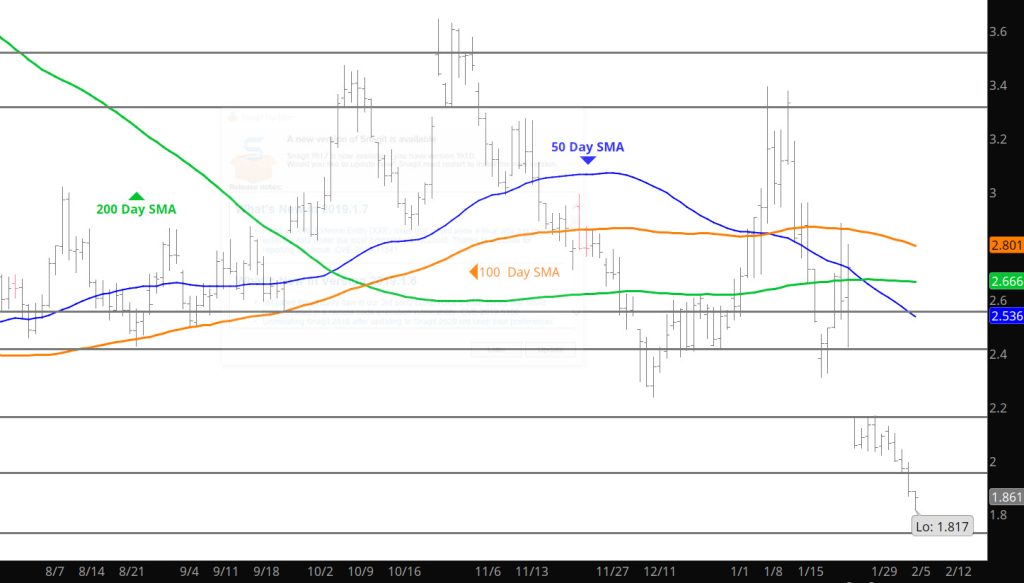
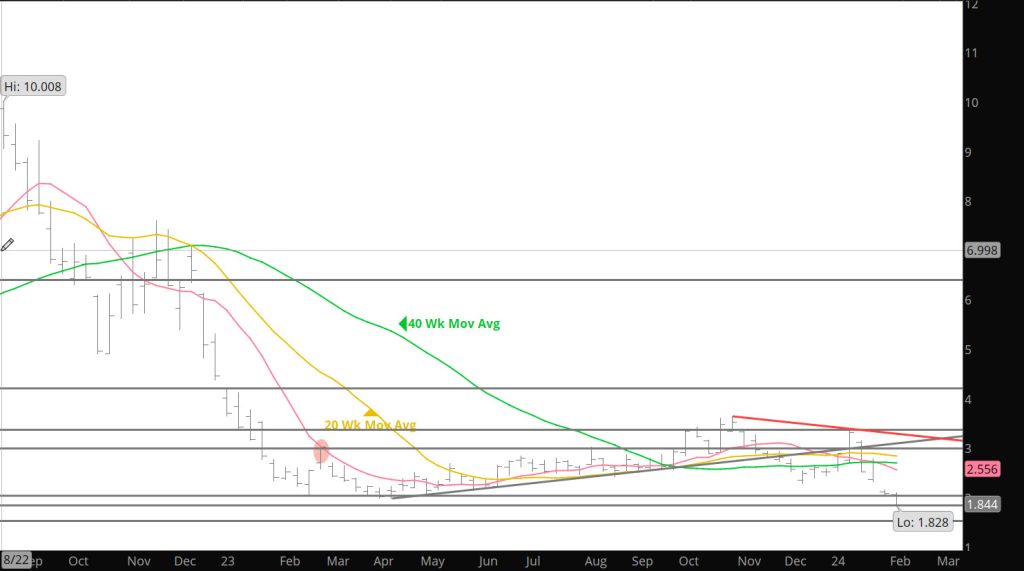
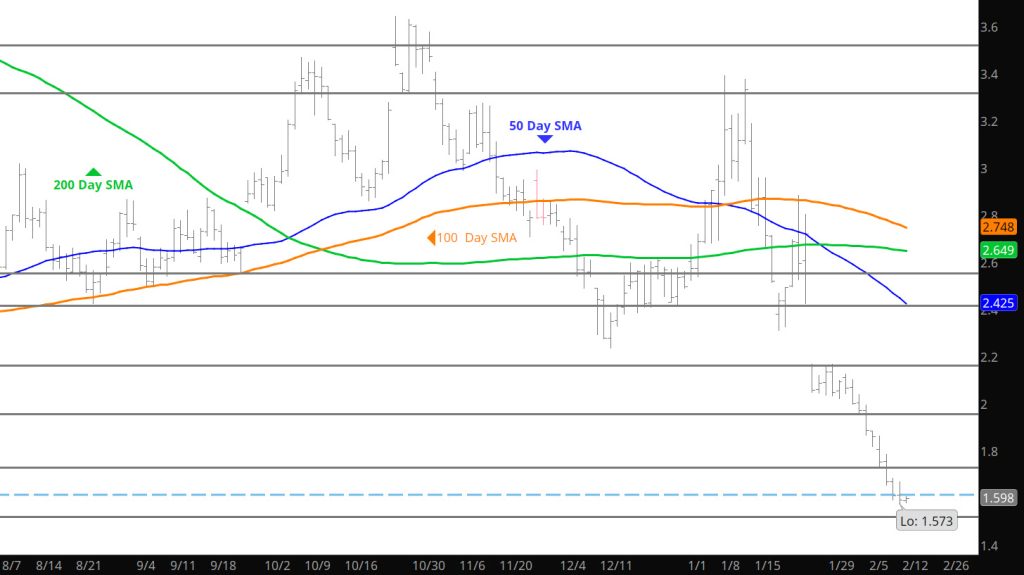
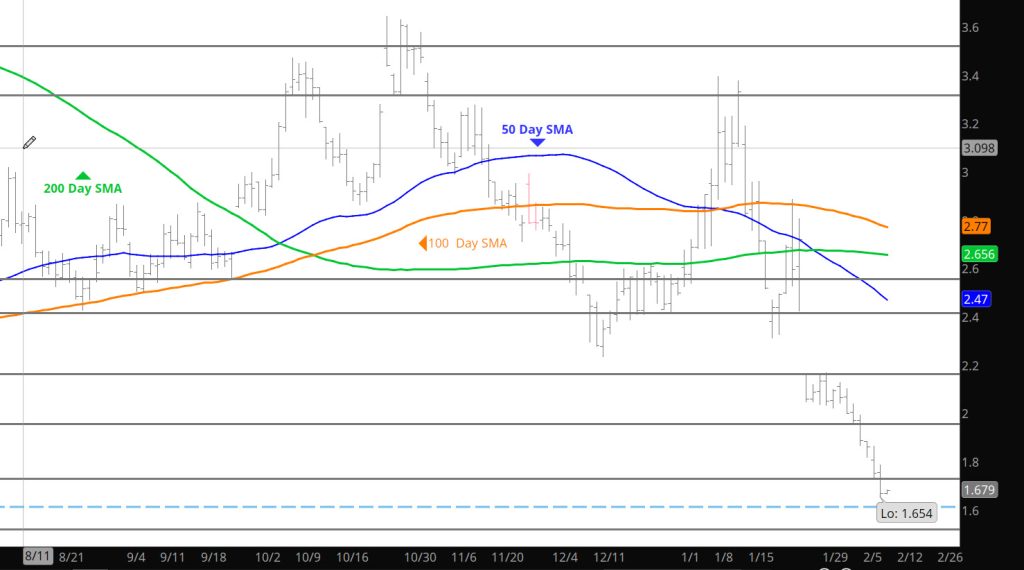
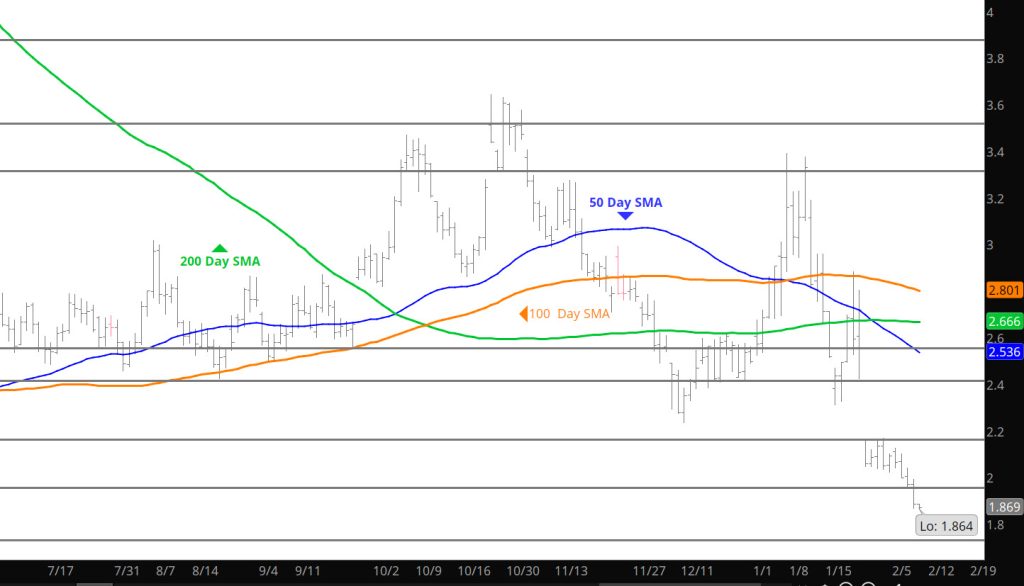
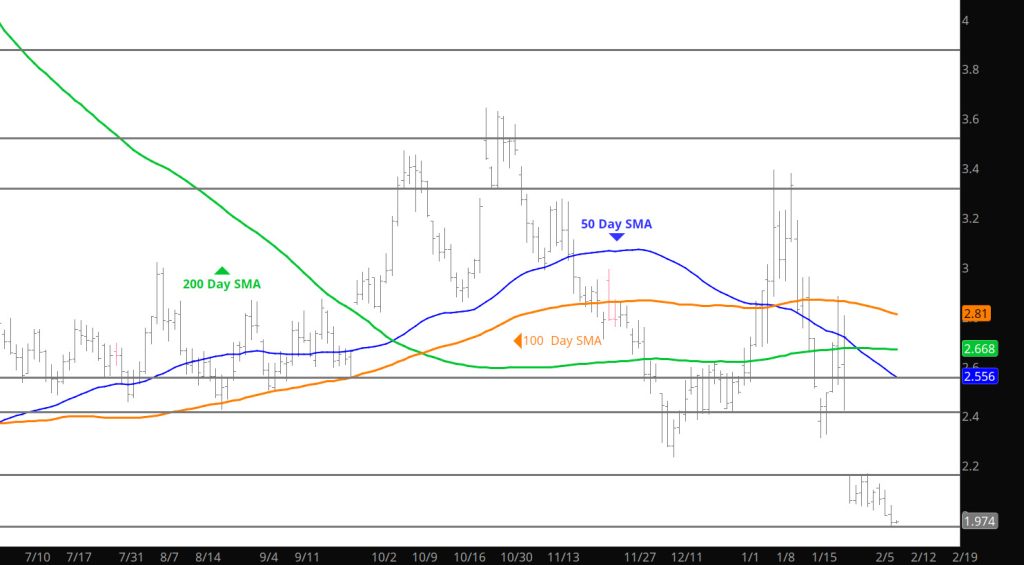
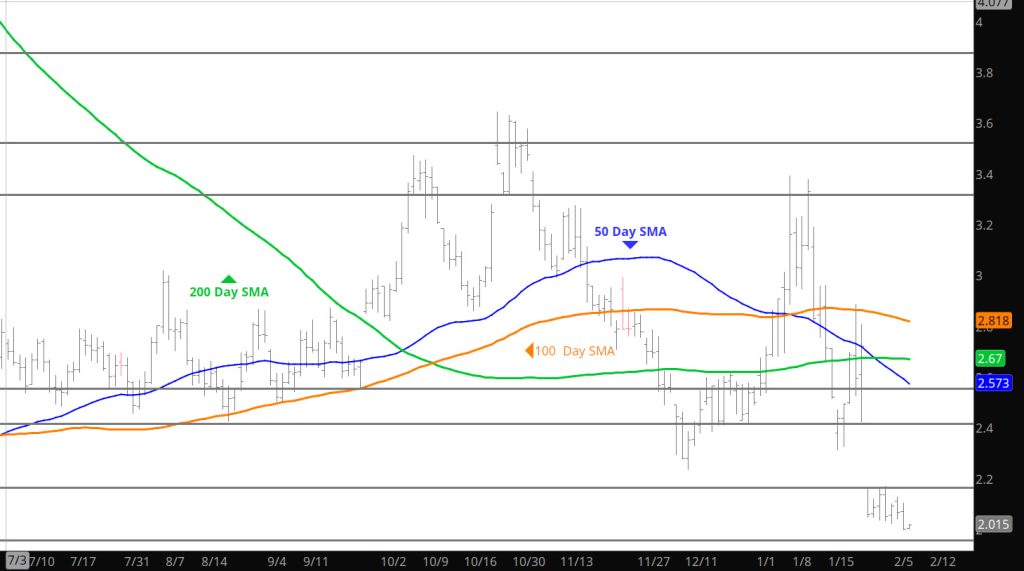
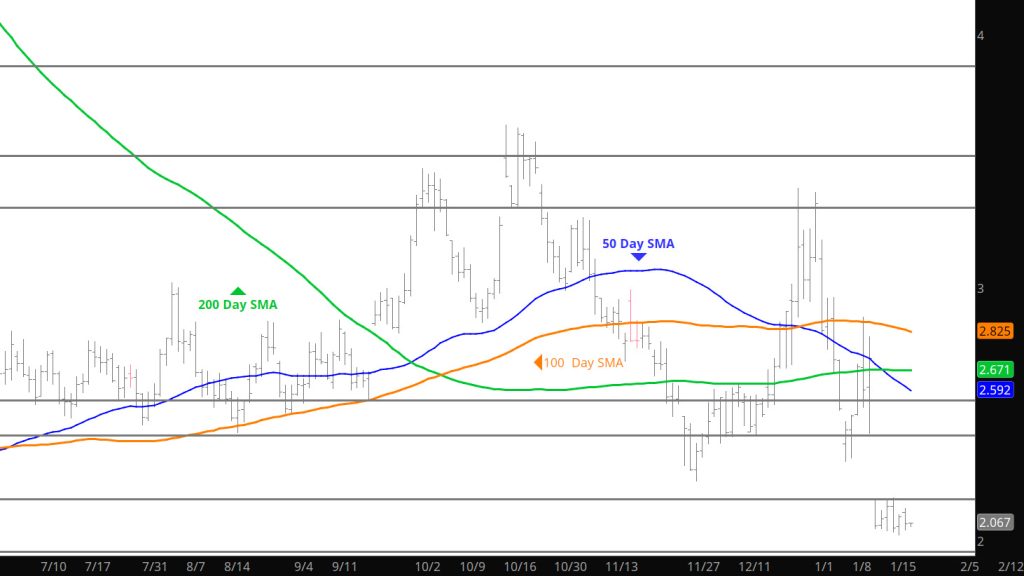
That is the mantra for the speculators currently– Over-sold ??? Who cares keep selling. Have to admit one element that has been accurate three of the last four weeks is anticipating bearish storage reports beget more selling which has proven profitable on a day basis. Its been the theme for the month of January and Feb started off singing the same tune. These little tendencies are good for a quick position but would never hold over night due to the general over sold bias discussed of late. Did a look into the nature of who (segment) is selling since the Nov highs and hope to share with you over the weekend.

Major Support: 2.68, $2.533, $2.422, $2.238
Minor Support:
Major Resistance$3.536, 3.595, $3.63, $3.789, $4.128, $4.22-$4.39, $4.75-$4.825, $4.948

To read The Daily Call you must be a subscriber (Current members sign in here. ) Start your subscription today.

A Quiet Day

Daily Continuation

What a quiet day for natural gas yesterday, guess the bears ran into some issues is sending prices down further. Not much to say about the technical side from yesterday.

Major Support: $2.761, 2.68, $2.533, $2.422, $2.238
Minor Support:
Major Resistance$3.536, 3.595, $3.63, $3.789, $4.128, $4.22-$4.39, $4.75-$4.825, $4.948

Rally During Expiration

Daily Continuation

Was somewhat startled to see the rally on expiration– almost brought back memories of 2022 expiration’s. The rally to the close up to $3.109 but the March contract was left for dead $.25 lower. Now the market opens on Sunday night and prices are wanting to extend the declines to yet a lower low. Will not say that won’t happen, as natural gas always goes to extremes both up and down. Go into a lot of the technical considerations on the Weekly section– but due to the current condition of the bias would not be adding to bearish positions except on rallies back above $3.00.

Major Support: $2.761, 2.68, $2.533, $2.422, $2.238
Minor Support:
Major Resistance$3.536, 3.595, $3.63, $3.789, $4.128, $4.22-$4.39, $4.75-$4.825, $4.948

To read The Daily Call you must be a subscriber (Current members sign in here. ) Start your subscription today.

Bearish Technical Indicators Continue

Weekly Continuation

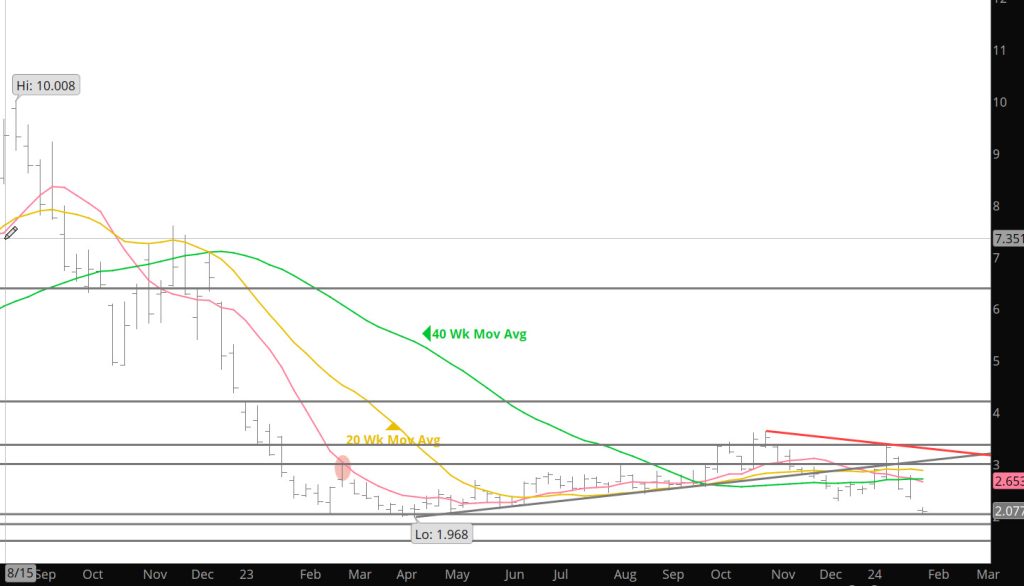
Despite the rally on expiration (almost reminded me of several expiration’s last year) prices closed the week lower for the sixth consecutive week– clearly a bearish indicator for the week coming. Along with that expiration, March did not follow the gains rather, closing the week $.25 below the expiration of February.

Early indications have the week gaining open interest (even with expiration) with gains in volume week over week. The losses do come with an RSI reading that is in the extreme zone (chart below is after the Sunday opening).

To read The Daily Call you must be a subscriber (Current members sign in here. ) Start your subscription today.

Feb Contract Going Into Free Fall

Daily Continuous

Prices just continue to press lower — which is great for some — for me I cleared my shorts on the failure of the rally on Monday. Left a few chips on the table — but I sleep well. Got no clue where this is going to decline down to but, as mentioned yesterday, lots of folks are on one side of this boat and I am not one of them. Will be out of internet service tomorrow so there will be no Daily for Friday.

Major Support: $3.18-$3.09, $3.00
Minor Support:
Major Resistance$3.536 –$3.63, $3.789, $4.22-$4.39, $4.75-$4.825, $4.948, $5.056

Lots of Bears Gathering at Expiration

Daily Continuous

Heading into expiration all I can say is there is a whole bunch of bears going to the same river to feed at the same time. Whether or not the storage number has anything to add to the upcoming expected feeding frenzy — I offer little insight. What I can offer is caution as it has been my experience when so many are expecting an “outcome” whether bullish or bearish it rarely works out to expectations.

Major Support: $3.269, $3.18-$3.09, $3.00
Minor Support:
Major Resistance$3.536 –$3.63, $3.789, $4.22-$4.39, $4.75-$4.825, $4.948, $5.056

To read The Daily Call you must be a subscriber (Current members sign in here. ) Start your subscription today.

Daily Trade Educational

Daily Continuous

Prices opened strong on Sunday night and maintained strength for a couple of hours before being subjected to the current bearish sentiment and falling nearly to the close last Friday. Something interesting happened then’ as prices reversed and challenged the highs of the early trade. Not sure what can be made of that but history is telling me that prices are due to rally but how high is unknown.

Major Support: $3.269, $3.18-$3.09, $3.00
Minor Support:
Major Resistance$3.536 –$3.63, $3.789, $4.22-$4.39, $4.75-$4.825, $4.948, $5.056

To read The Daily Call you must be a subscriber (Current members sign in here. ) Start your subscription today.

How Low Does It Go

Daily Continuation

Analyze some of the historical precedence of the current market in the Weekly section, but the declines may start running into support in the market. In spite of many folks analysis — this market shows little signs of continued weakness with out providing a rally of sorts (perhaps to $3.75) before an additional leg lower. Sunday night trade has provided a strong chance for reaching that level as the opening was up to $3.48.

Major Support: $3.269, $3.18-$3.09, $3.00
Minor Support:
Major Resistance$3.536 –$3.63, $3.789, $4.22-$4.39, $4.75-$4.825, $4.948, $5.056

To read The Daily Call you must be a subscriber (Current members sign in here. ) Start your subscription today.

Another Lower Weekly Trade

Weekly Continuation

Prompt gas closed lower for the sixth straight week (each week since the peak of the seasonal rally to a mid – December high – a one week uptick following a two week decline from the November high). Over those weeks, on a closing basis, prompt January and then February have fallen from$7.024 to $3.174. That kind of decline is not unprecedented, but it is rare and it has been a long time since last occurring.

There are other mathematical indicators that are used to monitor the overbought/oversold condition of the market, one such tool looks at the percentage the market trades as compared to the 40 week Simple Moving average. At Friday’s close prompt gas was 53.7% below the now declining intermediate – long defining moving average. You may recall at the high weekly close during August prompt gas was 54.5% above the 40 – week. Over the history of natural gas trading there has only been one other comparable rally and decline that carried to similar extremes.

To read The Daily Call you must be a subscriber (Current members sign in here. ) Start your subscription today.

Further Declines Expand Low End of Range

Daily Continuous

Guess everyone is getting geared up for the upcoming bearish storage report as price expanded the range downward towards the end of the day. Still over sold (momentum indicators), continues to challenge 2 standard deviations below the 20 week SMA, and volume maintains average levels– looks like a bear market from the tech standpoint–but I have a lot of experience selling (or buying) at 2 standard deviations beyond the 20 wk — so I will stick with sell the rallies and defer to add to positions.

Major Support: $3.14-$3.00
Minor Support:
Major Resistance$4.22-$4.39, $4.75-$4.825, $4.948, $5.056

To read The Daily Call you must be a subscriber (Current members sign in here. ) Start your subscription today.