To read The Daily Call you must be a subscriber (Current members sign in here. ) Start your subscription today.
Author: Willis Bennett
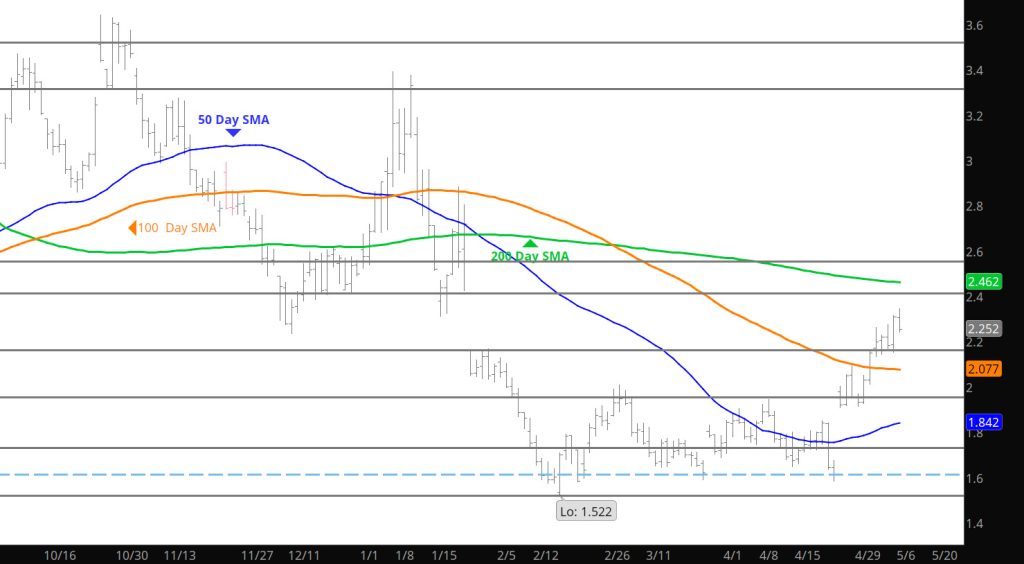
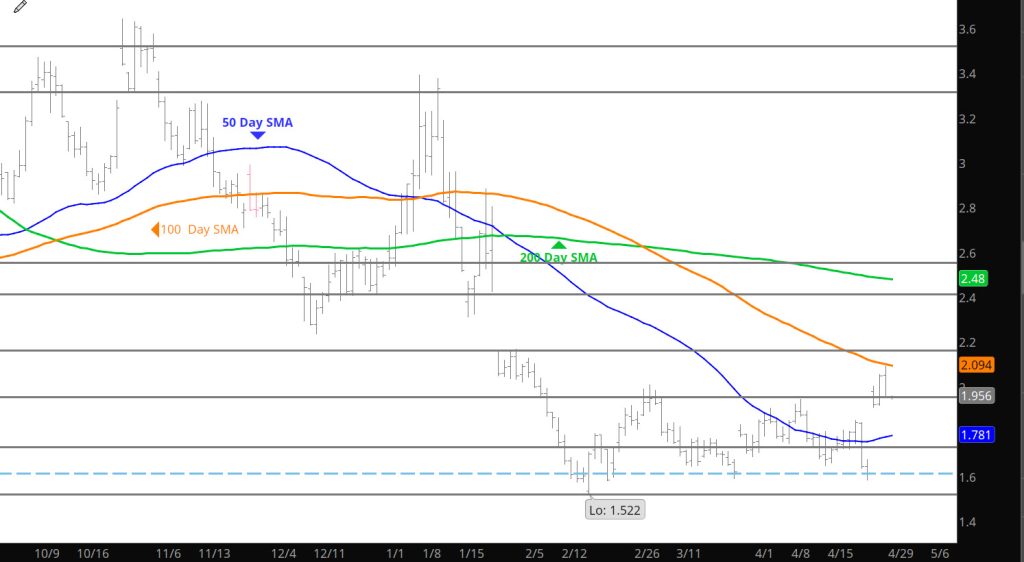
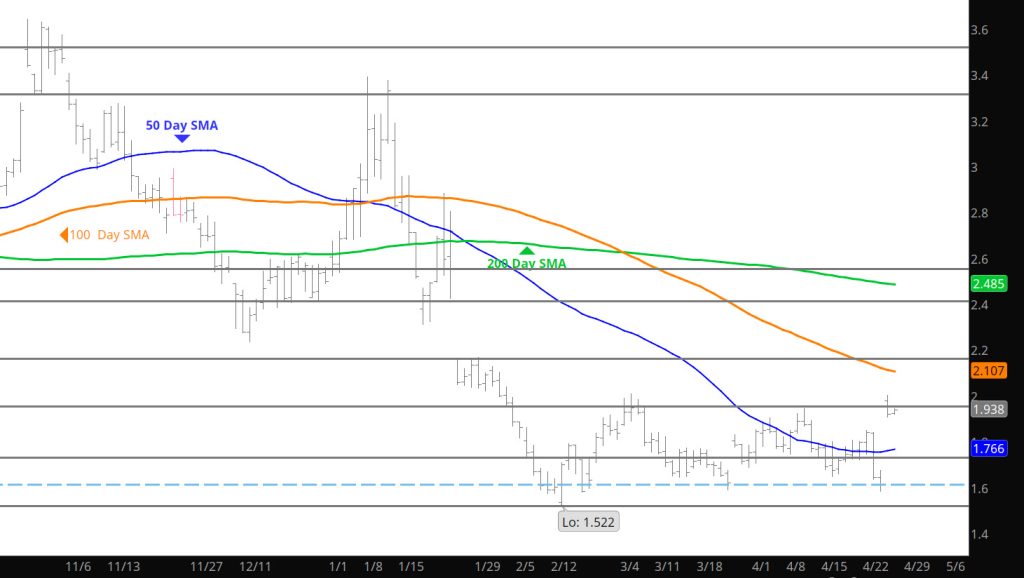
Additional Bites Into Gap
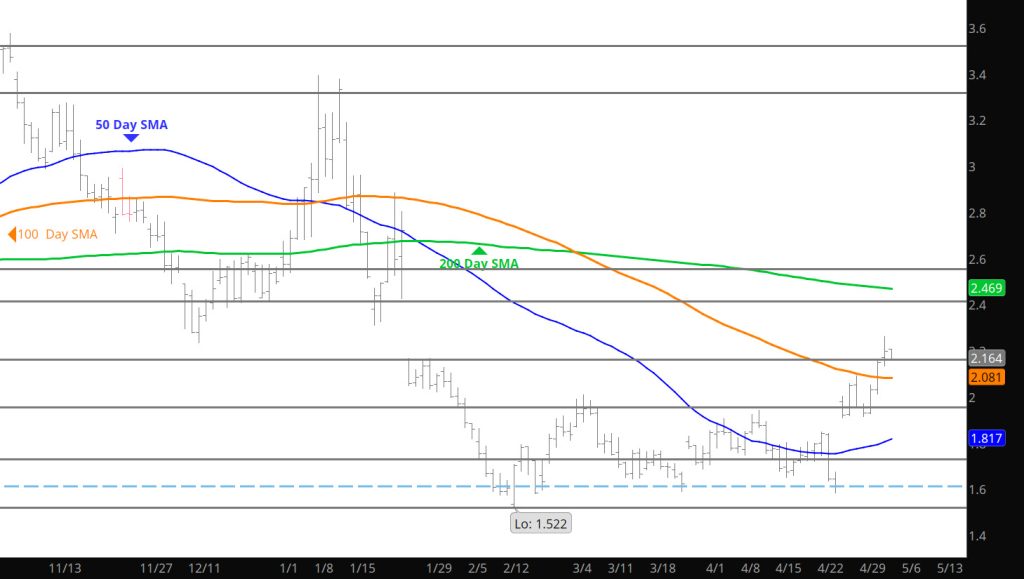
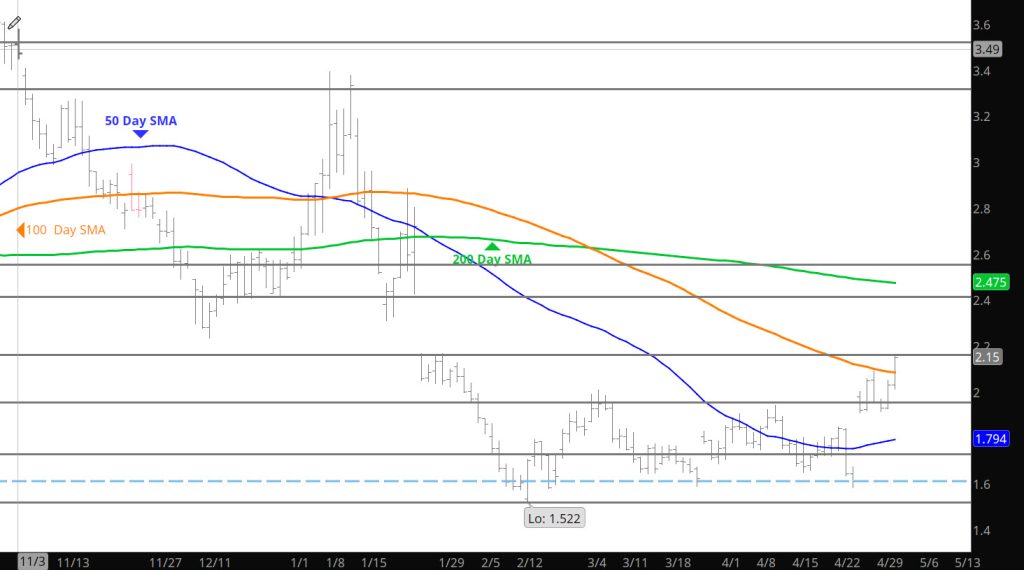
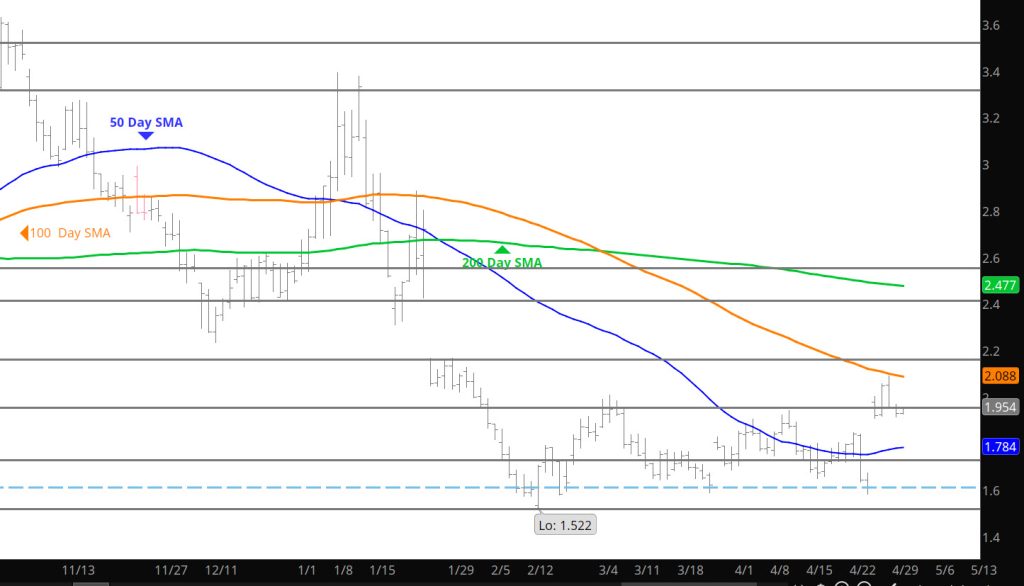
Daily Continuous
The rally continued after the storage release with prices testing near term support only to rally and bite into the gap from January. Playing with length seems to be profitable – but care and respect should be given to the gap closing– should it occur. The bias continues to confirm the change but time will tell and the weekly close should provide my more information.
Major Support:, $1.595, $1.52-$1.511, $1.481, $1.312
Minor Support : $2.12, $2.00, $1.967- $1.94
Major Resistance: $2.168-$2.411 (gap), $2.26
Important Storage Release
To read The Daily Call you must be a subscriber (Current members sign in here. ) Start your subscription today.
May Be Building a Near Term Base
To read The Daily Call you must be a subscriber (Current members sign in here. ) Start your subscription today.
A Little More of the Gap Close
To read The Daily Call you must be a subscriber (Current members sign in here. ) Start your subscription today.
Technically — A Bias Conversion
To read The Daily Call you must be a subscriber (Current members sign in here. ) Start your subscription today.
Prices Remain Firm
To read The Daily Call you must be a subscriber (Current members sign in here. ) Start your subscription today.
Prices Remain Within June Range
To read The Daily Call you must be a subscriber (Current members sign in here. ) Start your subscription today.
Didn’t Like the Altitude
To read The Daily Call you must be a subscriber (Current members sign in here. ) Start your subscription today.
Rare Close Over $2
To read The Daily Call you must be a subscriber (Current members sign in here. ) Start your subscription today.