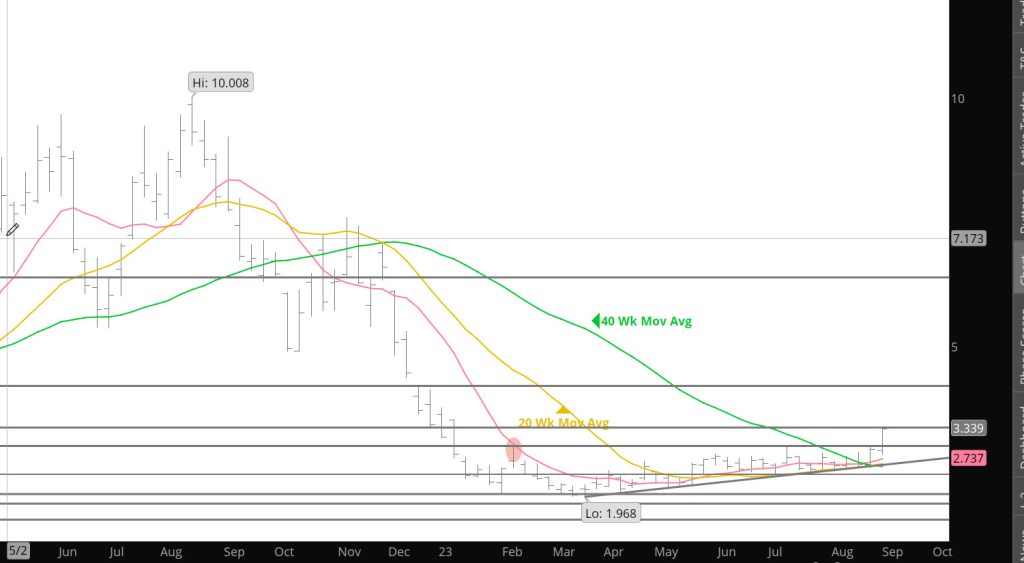
This past week, November started out lower, but rather than retreating enough to at least close the remainder of the “expiration gap” left last Thursday prices reversed from a low of $2.820 and posted a strong gain that was reminiscent of the rally to the August high (from $2.457 then prompt September rallied to $3.018 in five trading days) only to fail. This time the resistance that began to be defined by the March high ($3.027) and was further defined by highs during August and September ($3.018 and $2.997) failed to stem the surge of enthusiasm to buy November gas. By the time trading ended for the first week of October prompt gas added $.409 to last week’s close, putting some distance above last week’s first close over the 40 – week SMA since the peak of the December rally (Chart above). Friday’s extension of the rally also left November above its 40 – week and the continuation 50 – day SMA above the 200 – day for the first time since last November. Cannot define this as anything but positive technical events.
Another of the things that changed this week was that increases in volume and open interest accompanied the rally.You may recall that the lack of coordination between price and increases in the number of contracts outstanding and the number changing hands has been repeatedly discussed in the past (as recently as last week). Agreement of price change and market internals is critical for a sustainable trend. A week ago, their divergence was cited as the reason that the consensus of technical indicators failed to reach positive for the first time in many months. That flaw was cured this week. Higher prices (breakout over $3.02) with higher volume and expanding open interest matches the definition of a technical breakout.