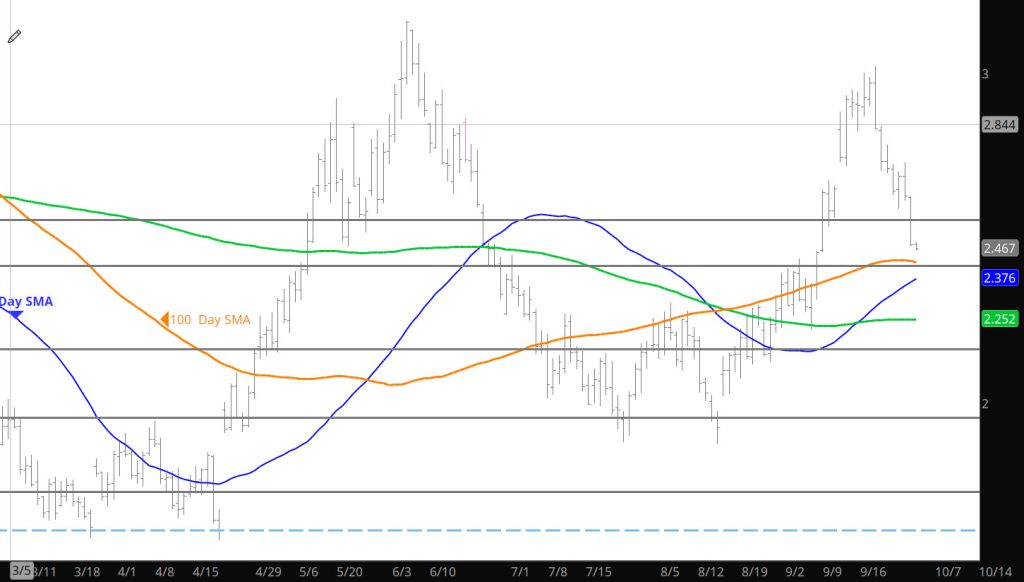
Did not see a break above the recent range coming but that was what happened yesterday. Not sure of the reason or focus for the gains except for the markets needing to challenge the highs (and potentially lows) of recent range trading. Perhaps, it was in advance of a storage release surprise coming tomorrow and known by some.
Major Support:, $2.35, $2.112, $2.026-2.00, $1.991, $1.93 ,$1.642, $1.605 Minor Support : $1.856,$1.89-$1.856 Major Resistance: $2.63, $3.00, $3.16
When markets hit their respective extreme zones on the Daily RSI– it is wise to expect some sort of a bounce. What occurred yesterday was just that sort of event. Longer term — the market may rebound a slight further but make no mistake there will be additional tests of support.
Major Support:, $2.35, $2.112, $2.026-2.00, $1.991, $1.93 ,$1.642, $1.605 Minor Support : $1.856,$1.89-$1.856 Major Resistance: $2.63, $3.00, $3.16
To read The Daily Call you must be a subscriber (Current members sign in here. )
The declines during last week left the market over sold on the Daily RSI reaching the extreme zone. While the Weekly RSI is not confirming yet, creating a slight divergence in the indicators. Prices are likely to continue to test the lows side of the range (creating the trade-able low). Would continue to trade the range from a selling premium standpoint.
Major Support:, $2.112, $2.026-2.00, $1.991, $1.93 ,$1.642, $1.605 Minor Support : $1.856,$1.89-$1.856 Major Resistance: $2.63, $3.00, $3.16
To read The Daily Call you must be a subscriber (Current members sign in here. )
Since October 4th December has traded to $3.406, the upper boundary of a trading range constructed on that chart since early July (the August high of December gas was $3.395), and down to $2.975-$3.000 is the lower boundary of its several months range (December set two lows during September, the first on 09/03 at $2.975, the second on 09/19 at $2.976, four times between 09/03 and 09/19 reversed higher from that support. Last week the sponsorship that had previously existed just on either side of $3.000. When that support failed last week, December traded to new contract lows back into the recent range trade.
To read The Daily Call you must be a subscriber (Current members sign in here. )
The storage release could not take prices out of the developing range trade– Not sure what will provide a stimulation for prices to expand to either the upside or downside — we are stuck in the range.
Major Support:, $2.35, $2.112, $2.026-2.00, $1.991, $1.93 ,$1.642, $1.605 Minor Support : $1.856,$1.89-$1.856 Major Resistance: $2.63, $3.00, $3.16
To read The Daily Call you must be a subscriber (Current members sign in here. )
Not much more to add from yesterday–that said if the market is going to be range bound for the near future then the concept of selling premium at the lows or the rallies come into focus.
Major Support:, $2.35, $2.112, $2.026-2.00, $1.991, $1.93 ,$1.642, $1.605 Minor Support : $1.856,$1.89-$1.856 Major Resistance: $2.63, $3.00, $3.16
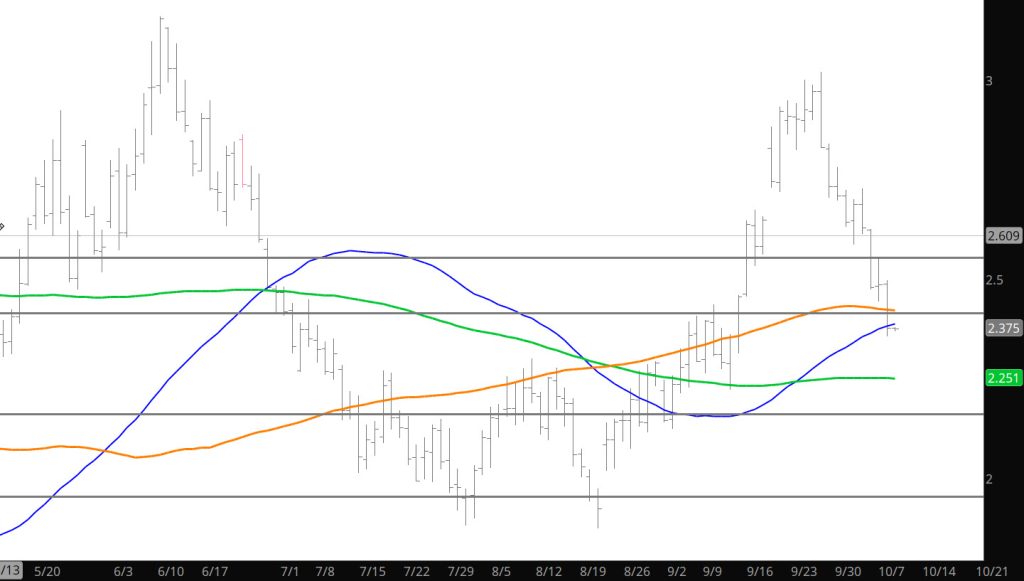
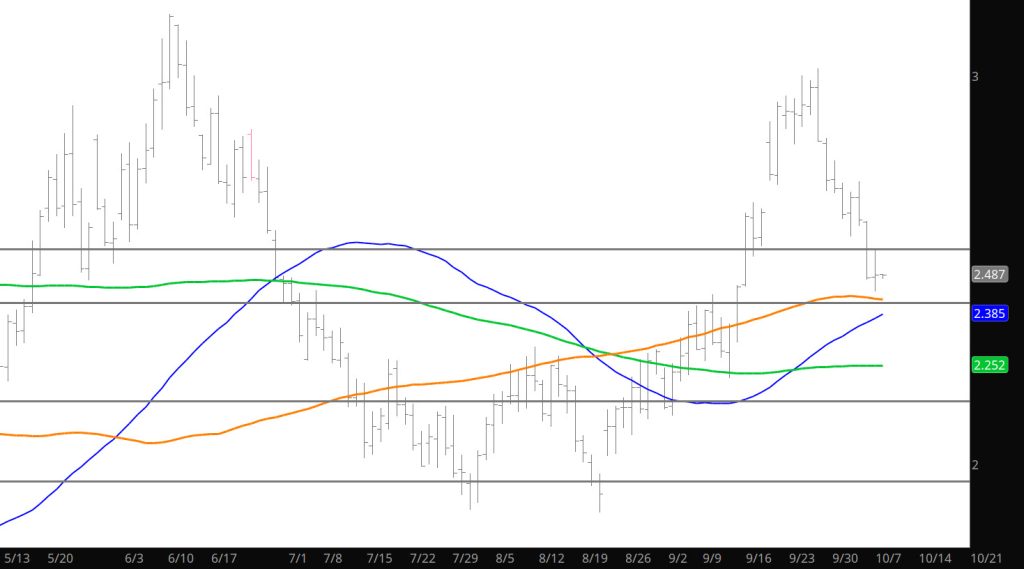
Just as the market consolidated the gains around $2.90 for a few says — the market is likely to consolidate the losses not between $2.40 and $2.55. All part of a range trade discussed in the Weekly.
Major Support:, $2.112, $2.026-2.00, $1.991, $1.93 ,$1.642, $1.605 Minor Support : $2.507-$2.44, $1.856,$1.89-$1.856 Major Resistance: $3.00, $3.16
Glad to have the Holiday, as if I would of published on Monday due to the market close from last Friday– I would have missed the additional $.13 loss that happened in the light volume trade yesterday. Prompt gas fell with increasing volume to and through the gap to support. The “bounce”, such as it was, came from support and it wasn’t much of a bounce. November failed at first resistance, the “outside” day reversal low November traded on 09/26. Reversing again from that resistance with significantly less volume left the prompt below its 50 – day SMA and likely set the stage for a test of support at a lower price level.
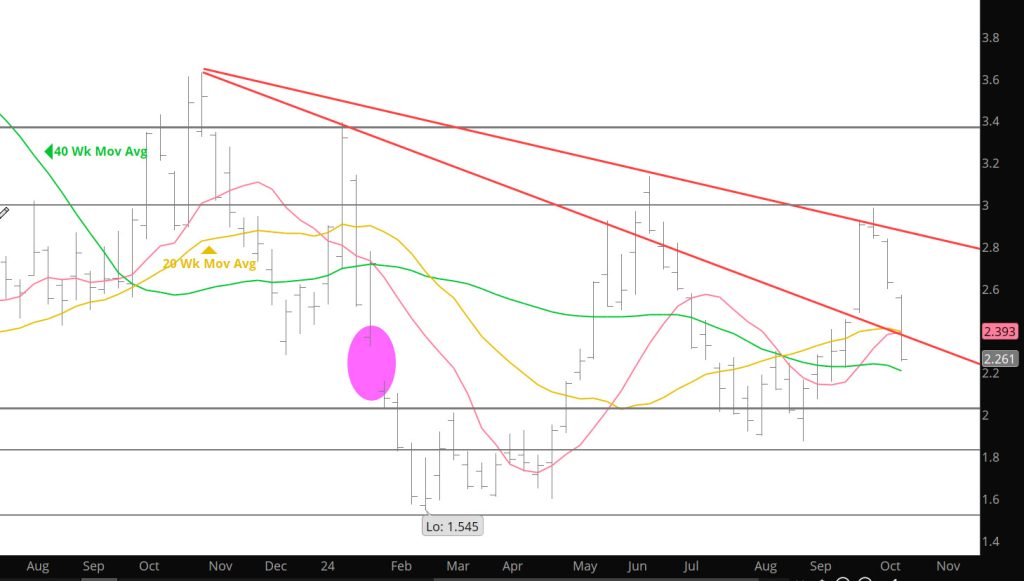
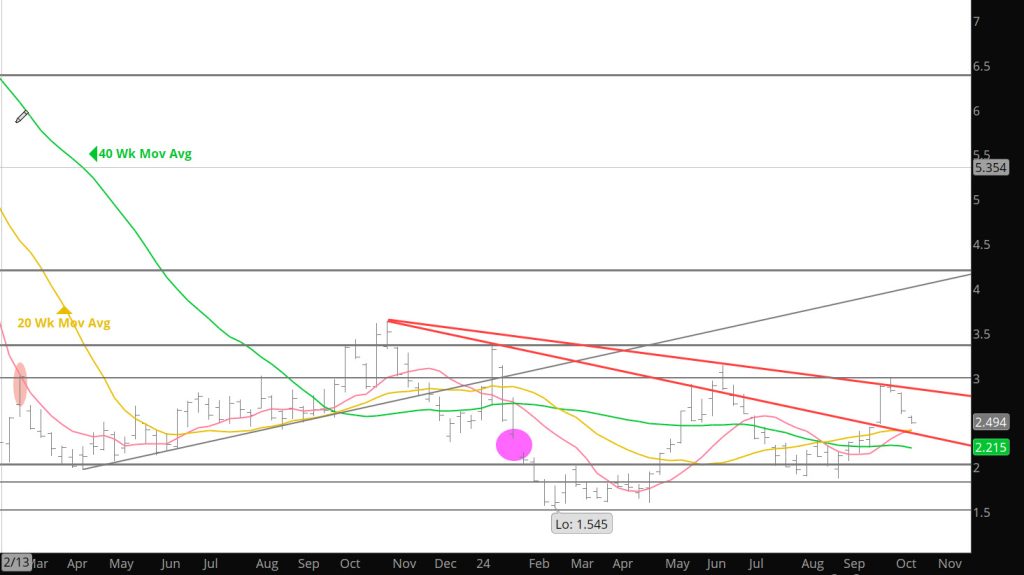
The failure left a fourth lower high. The first was in November ’22, which was lower than the August ’22 counter seasonal high; the second was the October ’23 Q4 high. The third was in January, the fourth last week. Unless/until prompt gas conclusively breaks from that pattern, the technical presumption is that declines and failure at the resistance zones will continue. It also is likely to effect the premium afforded to deferred/distant deferred contracts as they will dissipate as their maturity dates draw nearer
After gaining $.313 over the two weeks ending 09/27, November declined $.270 over the next ten trading days. From its close on 09/12 until Friday’s close November is exactly $.001 higher. Despite extension of the Q4 rally to the October 4th high at $3.019 that is not a characteristic of a continuing bull market. The deferred months, which all had gained modestly previously (while November ended lower) the deferred contracts gave up the lion’s share of gains from their August/September lows.
The consensus of technical indicators, which moderated somewhat last week continued to deteriorate. The continuation weekly RSI, which two weeks ago ended within its historical EXTREME zone is negative and not yet oversold. The daily RSI, which showed a confirmed bearish momentum divergence at the highs remains negative and still above its extremely oversold zone. Average daily volume increased significantly as prompt gas fell. Total open interest fell along with price, which is at least a mild technical positive. As mentioned last week, it is interesting that the total number of contracts outstanding is almost the same as at the beginning of August. My guess is that suggests that there is no real conviction on the part of longs or shorts…which is characteristic of prices remaining in a definable range.
Major Support:, $2.112, $2.026-2.00, $1.991, $1.93 ,$1.642, $1.605 Minor Support : $2.507-$2.44, $1.856,$1.89-$1.856 Major Resistance: $3.00, $3.16
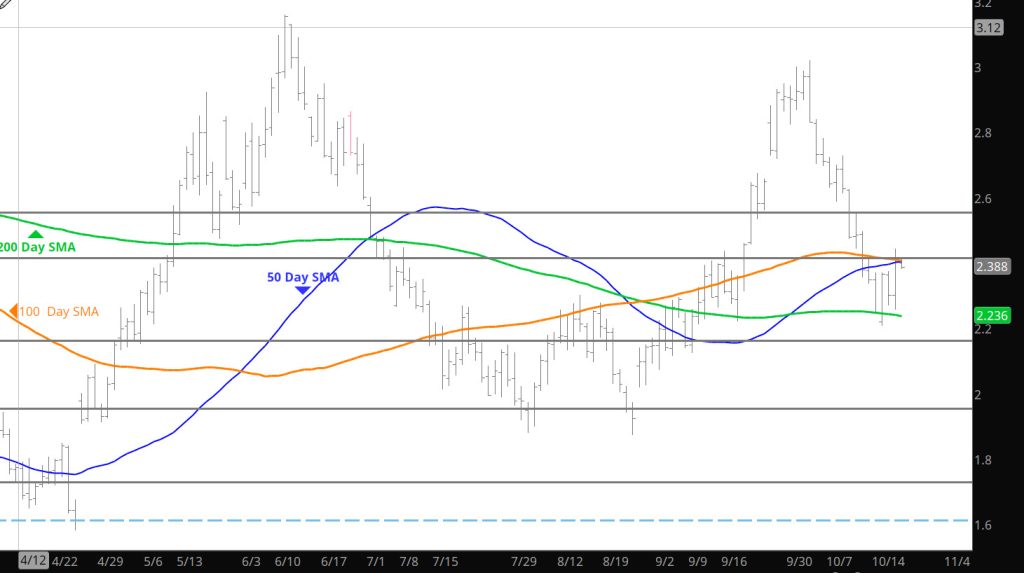
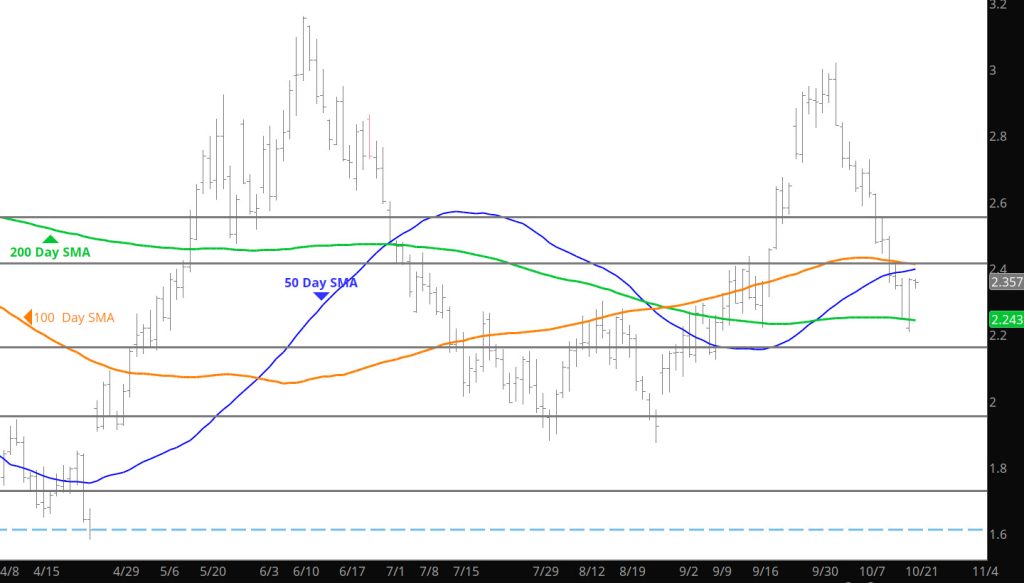
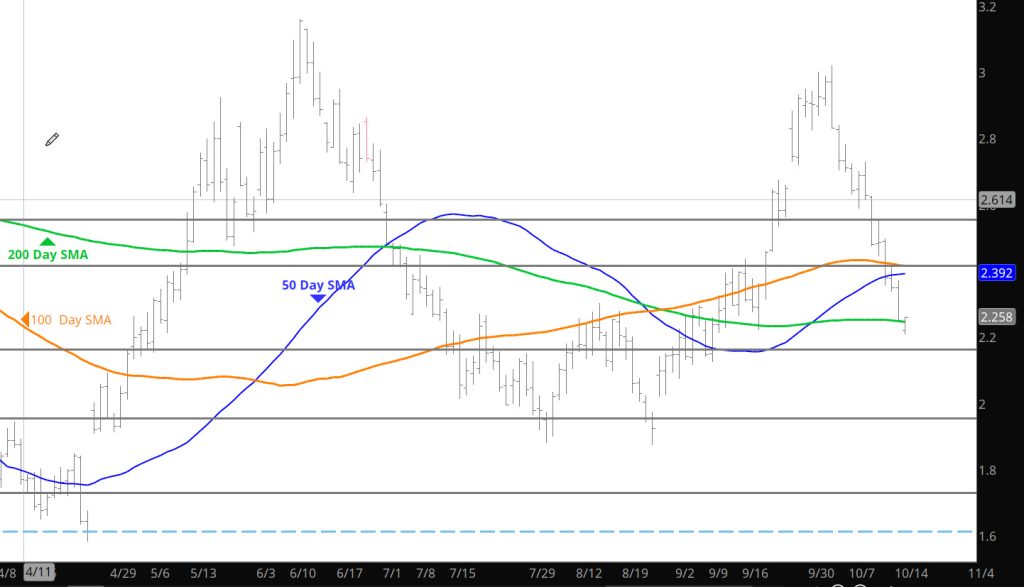
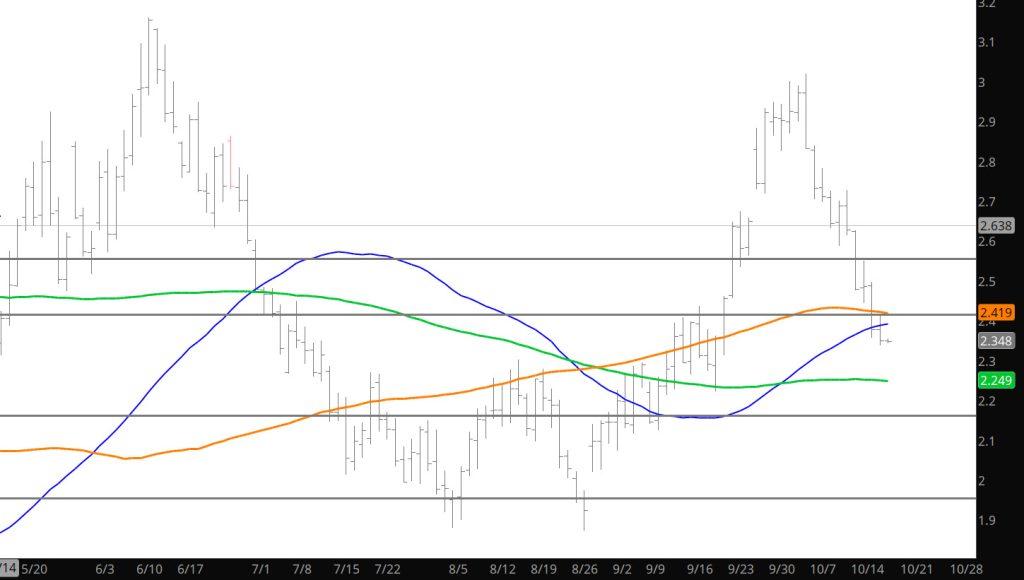
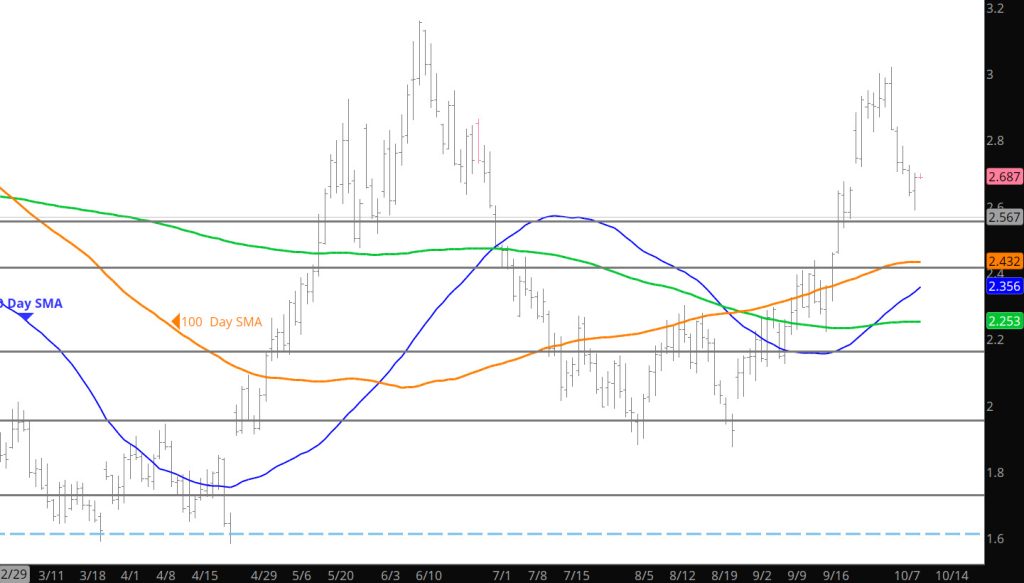
Was going to send out a Daily yesterday before I remembered it was a Holiday– glad I didn’t as I would of missed the additional $.14 decline that sent price down to a key medium support zones: the September low of November gas, $2.439; 38.2% retracement of the rally from the August low and 50% retracement of the rally from the April low, $2.432 –$2.438; the continuation 20 – week SMA, $2.418. That will provide significant support for prices in the near term. The upside remains $2.68-$3.00.
Major Support:, $2.112, $2.026-2.00, $1.991, $1.93 ,$1.642, $1.605 Minor Support : $2.507-$2.44, $1.856,$1.89-$1.856 Major Resistance: $3.00, $3.16
Well that was quite a response to the storage data as price collapsed down to below $2.60 only to rebound above $2.63 in less than 5 minutes– Wonder if the market found a bottom. The rebound continued quietly for the remainder of the trade day and settle just about flat to Wednesday. A set up is now in place for the weekend and I would expect some slight firming today.
Major Support:, $2.112, $2.026-2.00, $1.991, $1.93 ,$1.642, $1.605 Minor Support : $2.62, $2.507-$2.44, $1.856,$1.89-$1.856 Major Resistance: $3.00, $3.16
To read The Daily Call you must be a subscriber (Current members sign in here. )