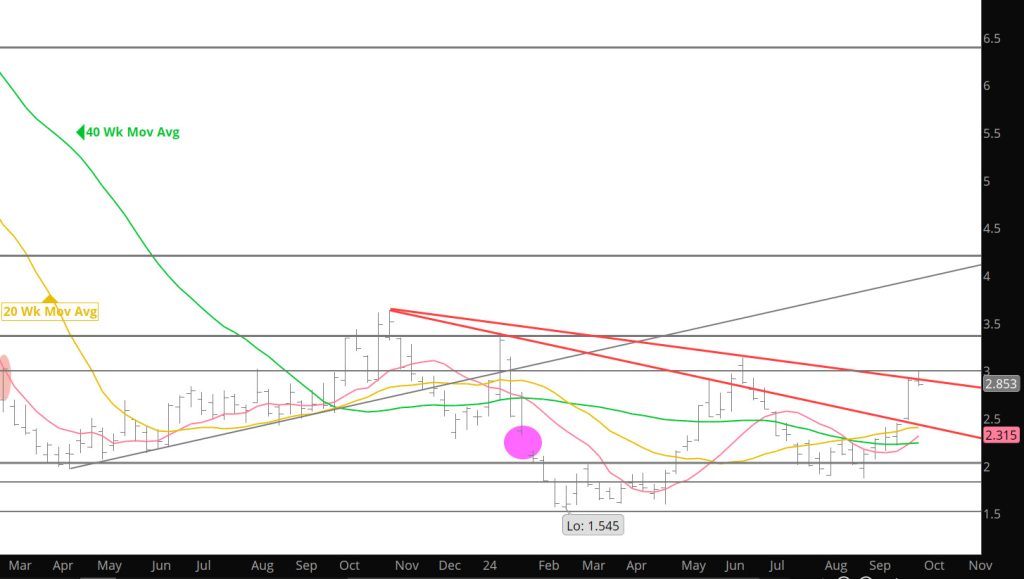
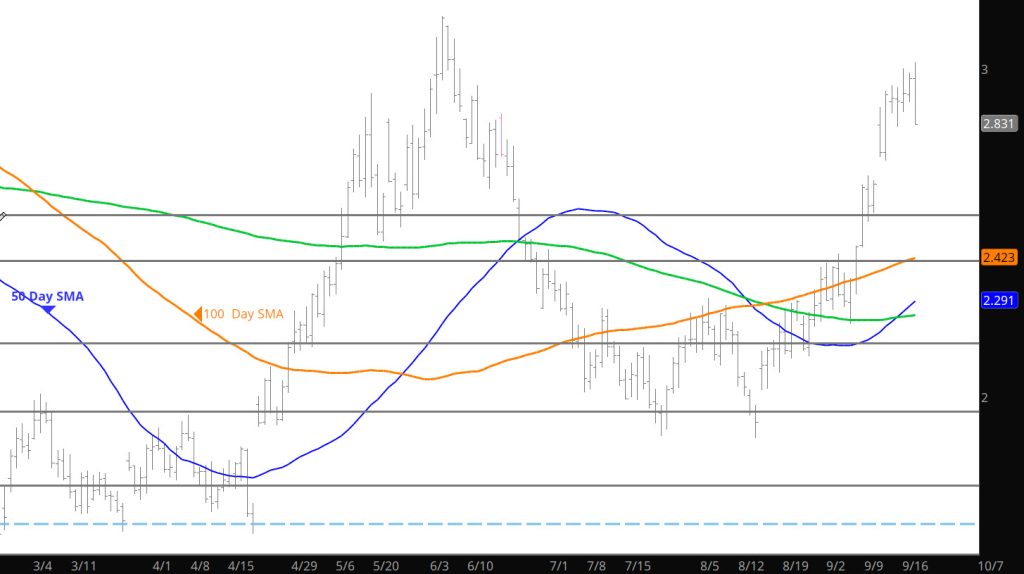
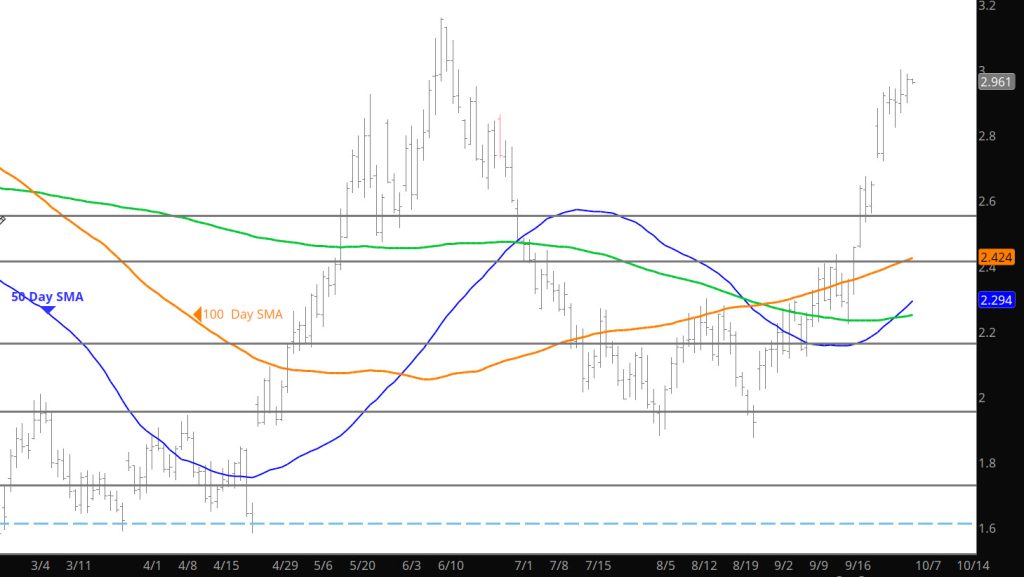
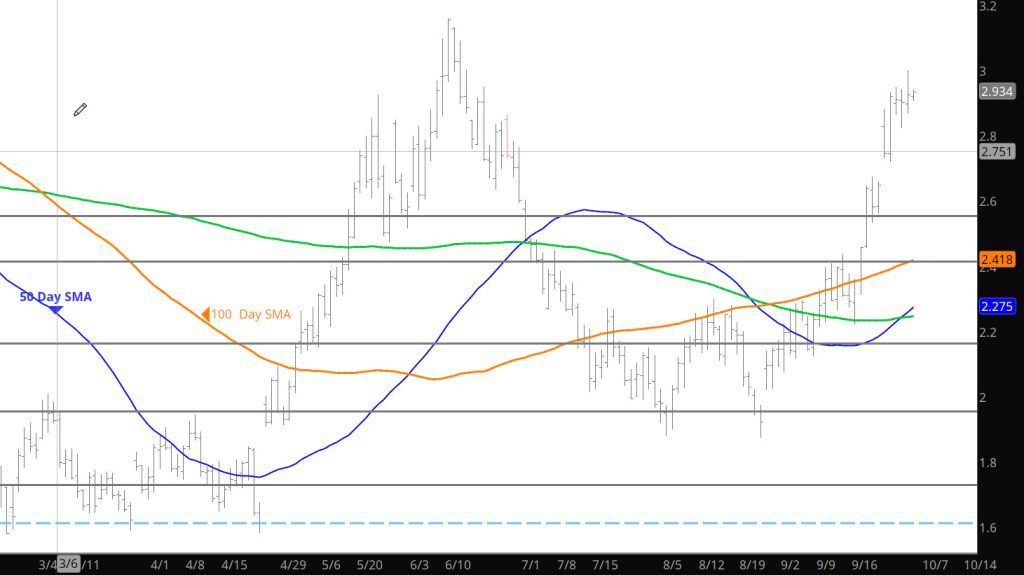
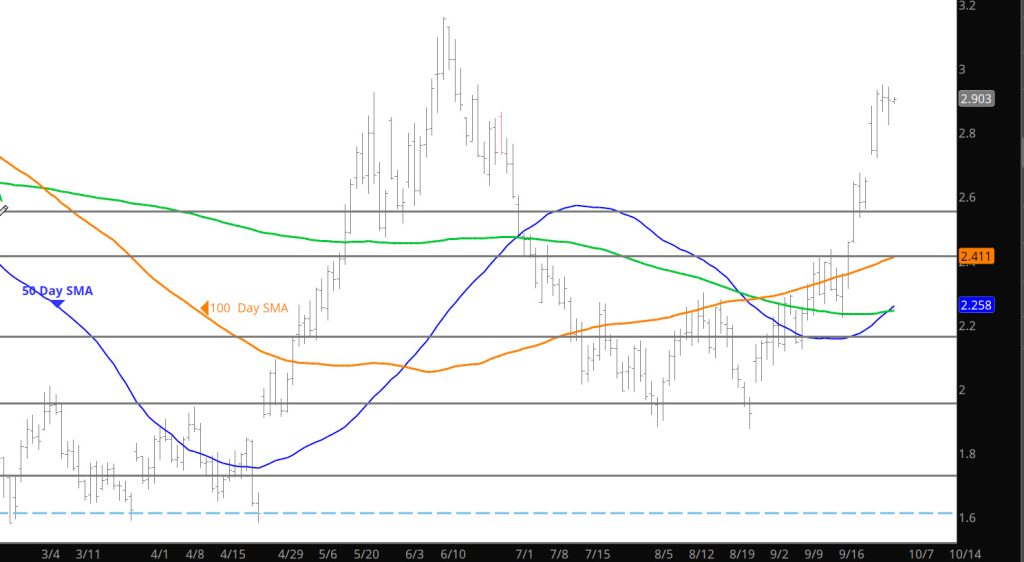
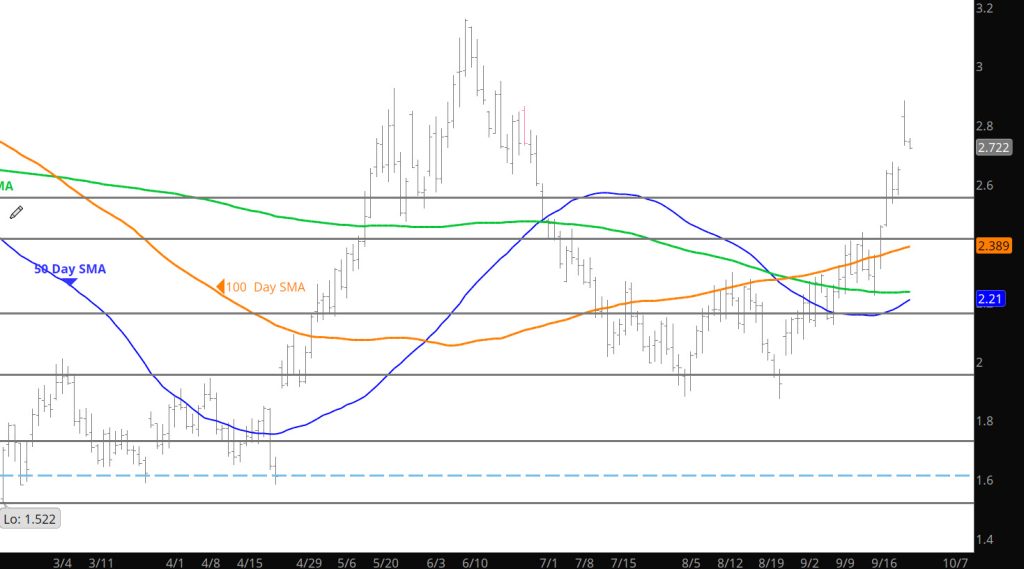
Bearish

Daily Continuous

Breaking trend line support and most moving average support lines, the declines have been impressive– so breathtaking that profit taking has commenced. We all know it isn’t going to zero (well at least not tomorrow) so warm weather forecasts will only last for a period of time and then the flip which will be ugly. In the meantime play the short side for daily trades.

Major Support: , $2.82-$2.78, $2.74, $2.608, $2.47, $2.00, $1.991-$1.96, $1.795-$1.766
Minor Support $3.16, $2.84, $2.38-$2.26, $2.17
Major Resistance $3.00, $3.48, $3.536, 3.59
, $3.65

To read The Daily Call you must be a subscriber (Current members sign in here. ) Start your subscription today.

Pushing Toward Major Support

Weekly Continuous

There are four trading days left in calendar November and the prompt has lost $.753/dt ( 21% from the 11/01 high to Friday’s close), while prompt – in – waiting January has lost $.842 as the premiums awarded deferred months continue to be compressed. This week’s low for January gas, $2.933 also happened to be the same as the contract’s low for the first week of June 2021.

With the weekly close only $.115 higher than the low close of 2023 and $.259 higher than the low close of 2021 (all weekly closes of ’22 were higher), the market may be providing opportunity to add to length. Note that December ’24 is currently priced at $4.039 making the “new” continuation strip certainly higher when December goes to settlement and is replaced. My thoughts are not to pay the premium that results from that replacement but rather to bide your time and wait for the premium in the differed contracts to dissipate while keeping a close eye on the support between those old continuation lows and the average settlement value of the last twelve months or so.

To read The Daily Call you must be a subscriber (Current members sign in here. ) Start your subscription today.

Press Lower

Daily Continuous

As suggested in the Weekly yesterday, prices pressed lower and are now starting to attract the major support areas from the summer (what was resistance is now support). This will be interesting as volume during the holiday week is historically weak and may make the extending the declines easier.

Major Support: $2.98-$3.03, $2.82-$2.78, $2.74, $2.608, $2.47, $2.00, $1.991-$1.96, $1.795-$1.766
Minor Support $3.16, $2.84, $2.38-$2.26, $2.17
Major Resistance $3.48, $3.536, 3.59
, $3.65

Last Week Provides Negative Near Term Bias

Daily Continuous

Provided some insight as to the negative bias from last week in the Weekly section– but the bias is clearly negative and further declines should be expected. However, that being said there is some areas of significant support coming up so the trade will provide some interesting input.

Major Support: $2.98-$3.03, $2.82-$2.78, $2.74, $2.608, $2.47, $2.00, $1.991-$1.96, $1.795-$1.766
Minor Support $3.16, $2.84, $2.38-$2.26, $2.17
Major Resistance $3.48, $3.536, 3.59
, $3.65

To read The Daily Call you must be a subscriber (Current members sign in here. ) Start your subscription today.

Down– But Out???

Weekly Continuation

Since closing at $3.473 two weeks ago (the second highest weekly close of 2023) prompt gas has given up $.513/dt on a weekly closing basis. The rally from the March low to the October high ($3.630) has been retraced by a little over the 38.2% (Fibonacci retracement–technical level) but prompt gas remains above the intermediate term uptrend defining trend line rising from the April – May lows (Chart above). This trend line has been tested several times since the spring low. I would allow this as a pretty normal correction– 50% retracement of the rally is $2.787, which happens to be almost exactly the price needed to close the “expiration gap” left on 09/28 (natural gas abhors a vacuum). Prices declining will once again test the rising trend line (on a daily continuation basis the value of that trend line begins the week at $2.807) then test the 20 – week SMA (currently $2.832).

Technical thinking was that December would retreat to test support at the double bottom left on 10/03 and 10/23 (twin weekly lows at $3.216), the lower boundary of an orderly trading range. Indicators did not expect the gap lower on 11/06, a gap that remains open and confirms an RSI bearish momentum divergence. The combination of those technical factors suggests declines have not concluded.

To read The Daily Call you must be a subscriber (Current members sign in here. ) Start your subscription today.

Storage Report Brought Volatility

Daily Continuous

Expected the potential for volatility but a $.238 range yesterday seemed a little over done. Regardless, prices now have to deal with the key $3.00 area that was rebuked last week at the 50 day SMA. So here we sit — if you a bullish bias trader, then buying on this decline with a stop just below the key support zoned makes for a low risk trade. If you are a bearish bias the you need to see a close below the key area to add to positions.

Major Support: $2.98-$3.03, $2.82-$2.78, $2.74, $2.608, $2.47, $2.00, $1.991-$1.96, $1.795-$1.766
Minor Support $3.16, $2.84, $2.38-$2.26, $2.17
Major Resistance $3.48, $3.536, 3.59
, $3.65

Storage Report Brings Implications

Daily Continuous

Not sure what the release will show but taking into the fact that it reflects two weeks of activity — the potential for volatility is high. The market, though, continues to reflect a consolidation phase type of behavior. If the previous months are any indication the range developing will have $3.00 as the low end and the highs of $3.64 finding sellers. Plan accordingly.

Major Support: $2.98-$3.03, $2.82-$2.78, $2.74, $2.608, $2.47, $2.00, $1.991-$1.96, $1.795-$1.766
Minor Support $3.16, $2.84, $2.38-$2.26, $2.17
Major Resistance $3.48, $3.536, 3.59
, $3.65

Consolidation of Recent Gains and Declines

Daily Continuous

Last week’s declines met with early gains this week — its not surprising that the market is going to consolidate and figure out its next directional bias (if only for a day or two). Developing a nice trading range that could provide $.25-$40 volatility in both directions.

Major Support: $2.98-$3.03, $2.82-$2.78, $2.74, $2.608, $2.47, $2.00, $1.991-$1.96, $1.795-$1.766
Minor Support $3.16, $2.84, $2.38-$2.26, $2.17
Major Resistance $3.48, $3.536, 3.59
, $3.65

Expected Run Now What

Daily Continuous

That didn’t take long for prices to rally, as discussed yesterday, and the run took prices up to low resistance zones. We shall see how far this rally goes and yes, the forecasts will have a lot to do with the run extension. I will stick with the technical data points and will trade accordingly with an eye to some forecasts defining sudden moves.

Major Support: $2.98-$3.03, $2.82-$2.78, $2.74, $2.608, $2.47, $2.00, $1.991-$1.96, $1.795-$1.766
Minor Support $3.16, $2.84, $2.38-$2.26, $2.17
Major Resistance $3.48, $3.536, 3.59
, $3.65

To read The Daily Call you must be a subscriber (Current members sign in here. ) Start your subscription today.

Doesn’t Get More Bearish

Weekly Continuous

Lets look at the technical side of trade last week– Lower low testing major support (holds for now) on increasing volume and increasing open interest. That sounds like a market that wants to decline further. The big area is the support zone where trade left last week at $3.00 should it hold then prices may rebound to test breakdown areas at $3.16, $3.25, and $3.32. Further declines will send prices back to the range trade of the late summer ($2.80-$2.64).

Last week’s action was off of bearish weather reports for November but I am not convinced they can get any more bearish and it is likely that weather will change. The bearish start to Q4 prices reminds my of a couple of years ago — but I have to look them up to comment. In the meantime — wanted to have you look at something I wrote to a client last week..

To read The Daily Call you must be a subscriber (Current members sign in here. ) Start your subscription today.