To read The Daily Call you must be a subscriber (Current members sign in here. ) Start your subscription today.
Author: Willis Bennett
Likely To Be Important Week for Bias
To read The Daily Call you must be a subscriber (Current members sign in here. ) Start your subscription today.
Rebound Off of Support
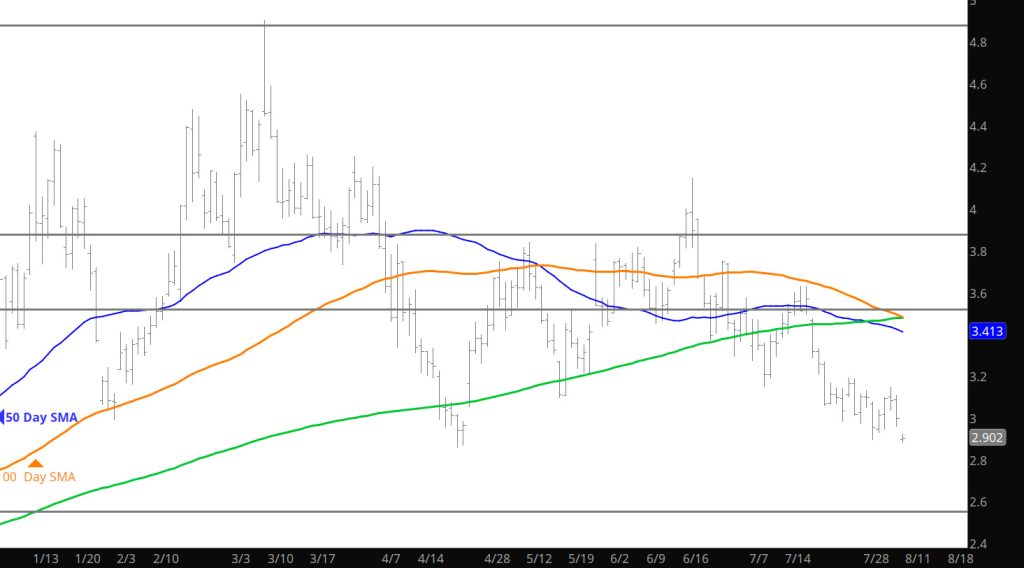
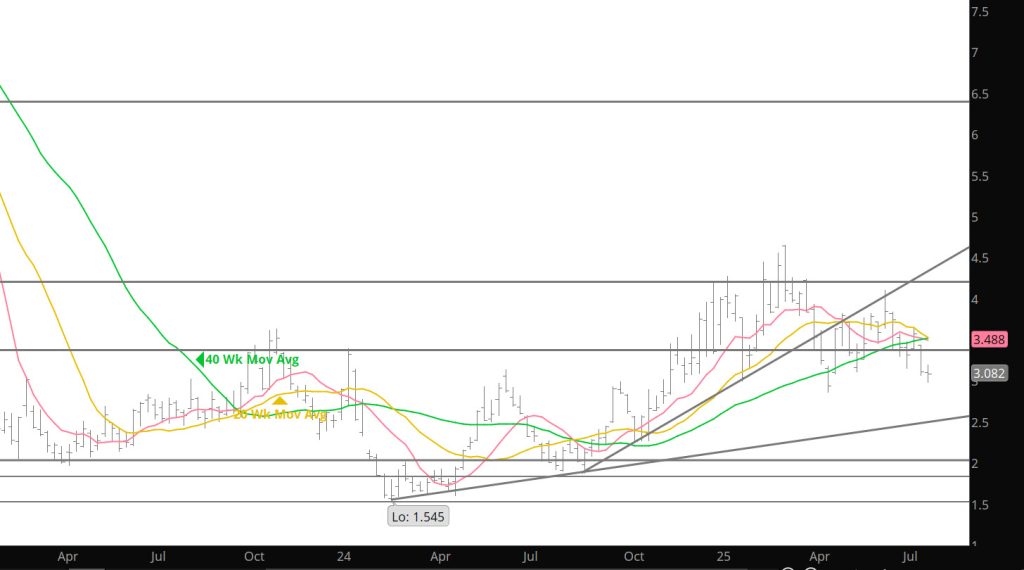
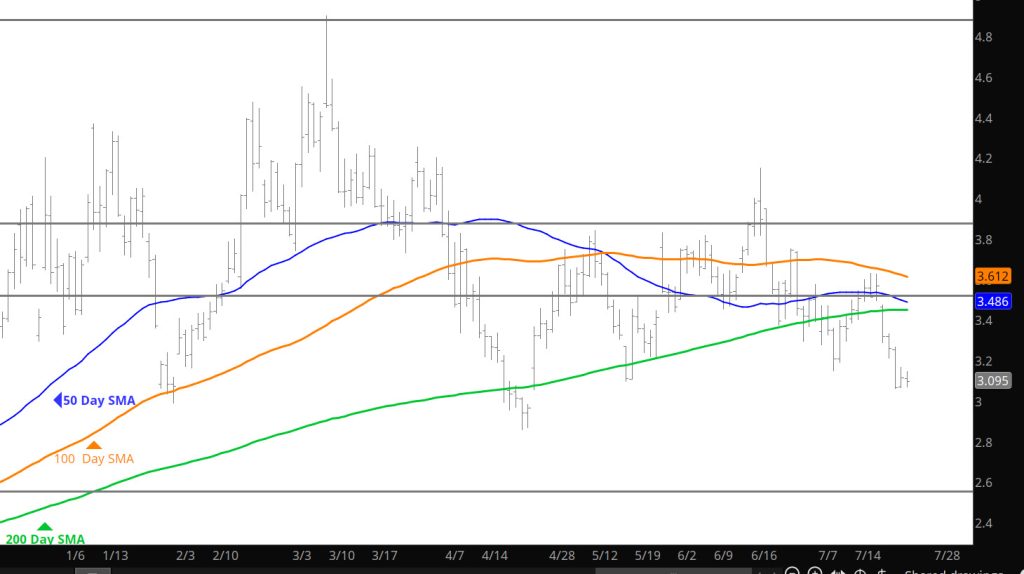
Daily Continuous
Spoke yesterday regarding the break down in prices and whether it was going to be built on with additional declines. Prices started lower, but then had a solid rebound. Next issue will be the storage release today and will the gains remain.
Major Support: $3.054-$3.007, $2.97, $2.727, $2.648,
Minor Support :
Major Resistance:$3.167, $3.25-$3.31,$3.39, $3.62, $4.168, $4.461, $4.501
Fake to the Down Side
To read The Daily Call you must be a subscriber (Current members sign in here. ) Start your subscription today.
A Market Needing Stimulus
To read The Daily Call you must be a subscriber (Current members sign in here. ) Start your subscription today.
Light Sunday Trade Wants to Break $3.00
To read The Daily Call you must be a subscriber (Current members sign in here. ) Start your subscription today.
New Prompt Same Range–Maybe Lower
To read The Daily Call you must be a subscriber (Current members sign in here. ) Start your subscription today.
New Prompt — New Range?
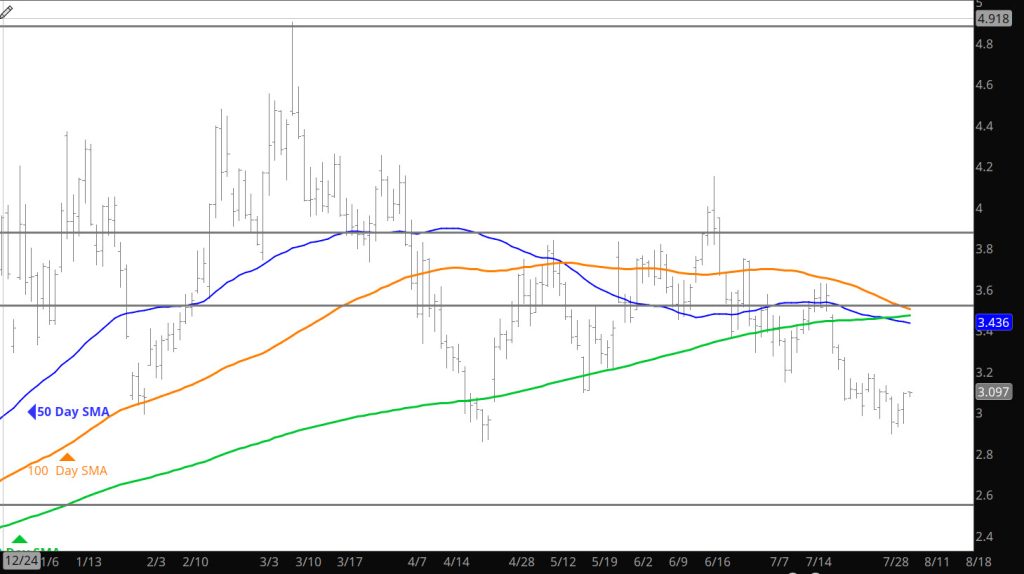
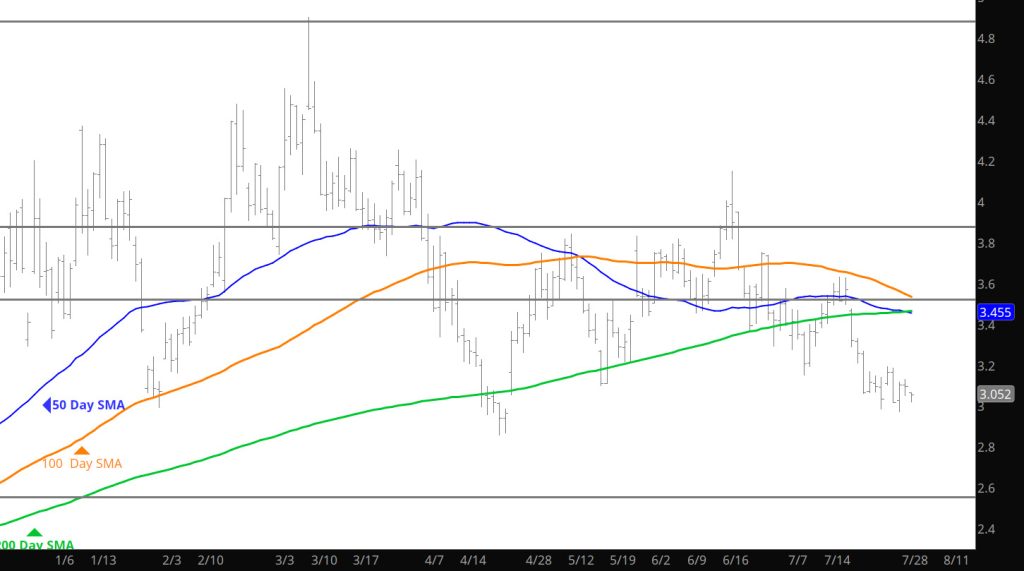
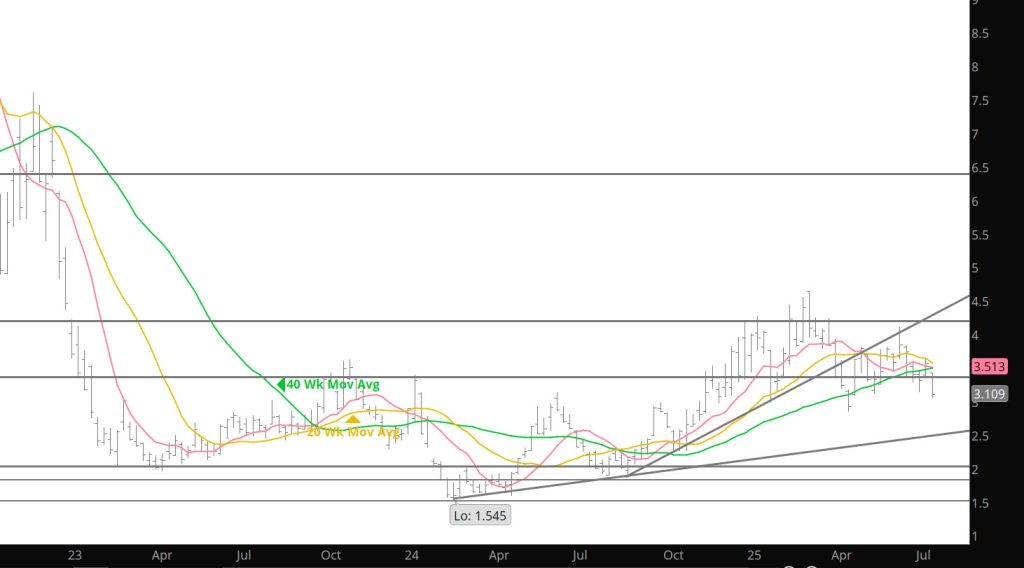
Daily Continuous
Expiration brought on a slight rally– we will have to wait for any follow through. We are at some lows maybe look to the winter months for long positions or prompt months for short postitions.
Major Support: $3.054-$3.007, $2.97, $2.727, $2.648,
Minor Support : $3.30-$3.26
Major Resistance:$3.25-$3.31,$3.39, $3.62, $4.168, $4.461, $4.501
Weakness Into Expiration Is the Recent Trend
To read The Daily Call you must be a subscriber (Current members sign in here. ) Start your subscription today.
Going To Keep Testing Lows
To read The Daily Call you must be a subscriber (Current members sign in here. ) Start your subscription today.