The bears are growling along now as prices closed the week below the long held support for the last few years. Having heard from many of them over the weeks it will be fun to watch the outcome. Technically, good luck and pick a number — any number — I am buying length in certain increments after playing the range for the last three months.
The trade last week left serious implications for future prices as the close near or below the long held (10+ year lows) will have longer impacts both up and down. The weakness is related (so I hear) to the effects of the virus and with the additional declines in crude oil prices. That tells me that declines due to the illness, there is less gas is used to keep homeowners warm than buildings which, not occupied, still need heat (avoiding frozen pipes) and therefore demand goes down. Seriously, you fundamental guys are twisted. Not sure where this goes down to but it will continue until this irrational perspective is concluded.
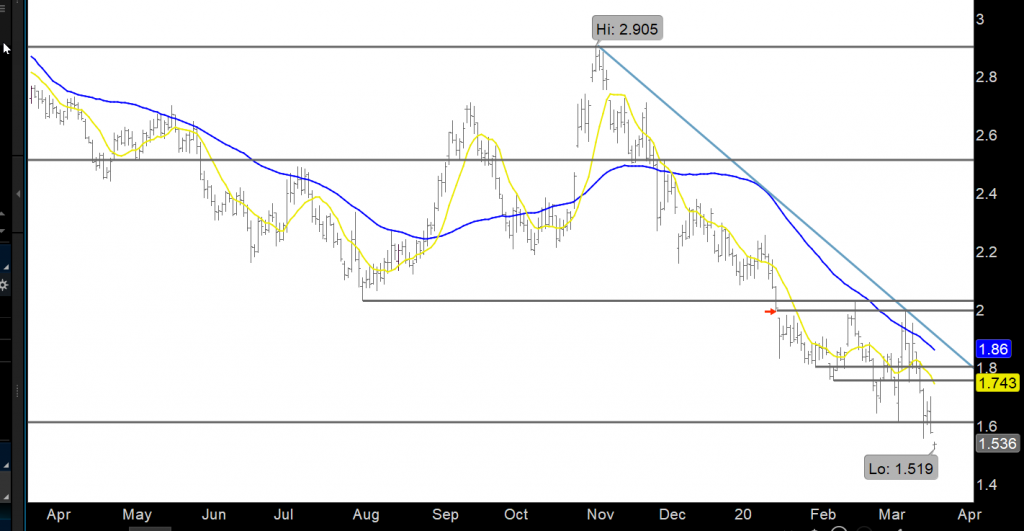
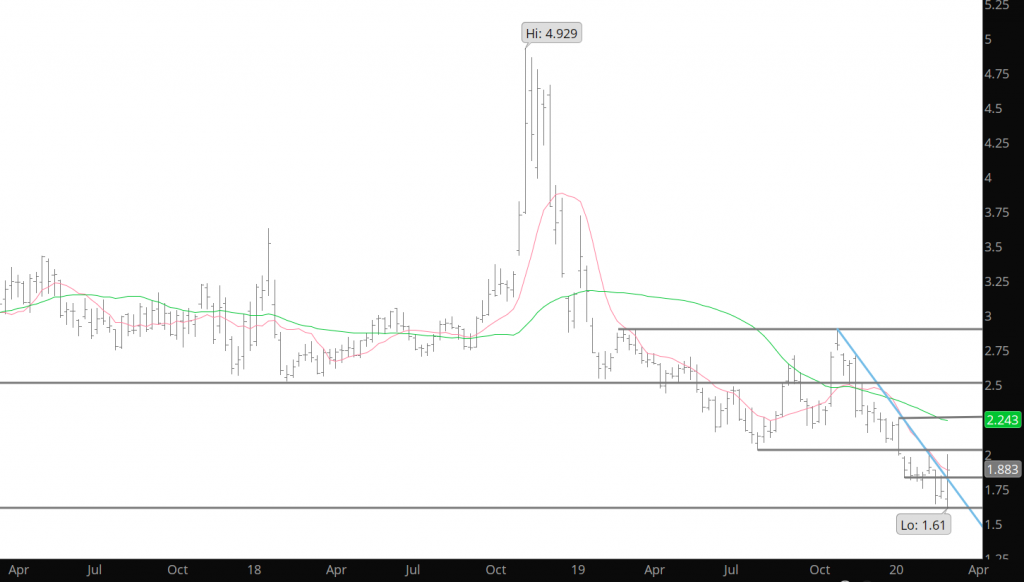
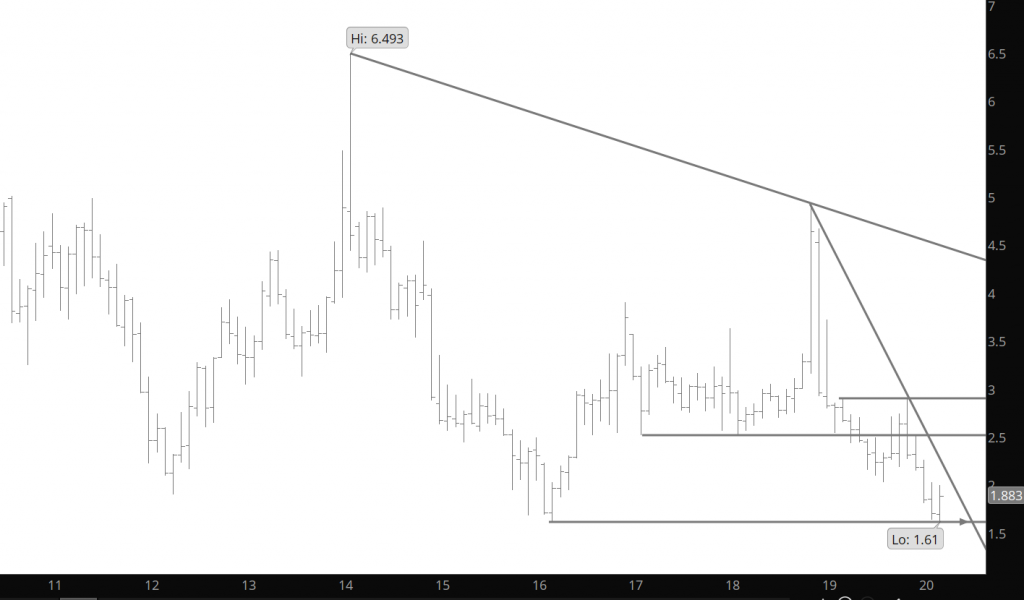
Monthly Continuous
All fundamental noise to me, as I look at the markets, is the interpretation of the virus and the oil war that has commenced. The price action does not blend with the potential of the producer cutting production in the upcoming weeks and the effects of the coming summer that will start occurring. Technically, there is no support down to lows from the mid to early 1990’s so good luck picking those bottoms.
Major Support: $1.611, $1.555 Major Resistance: $1.99, $2.029, $2.08-$2.10, $2.34, $2.437, $2.48-$2.52, Minor Resistance: $1.883,
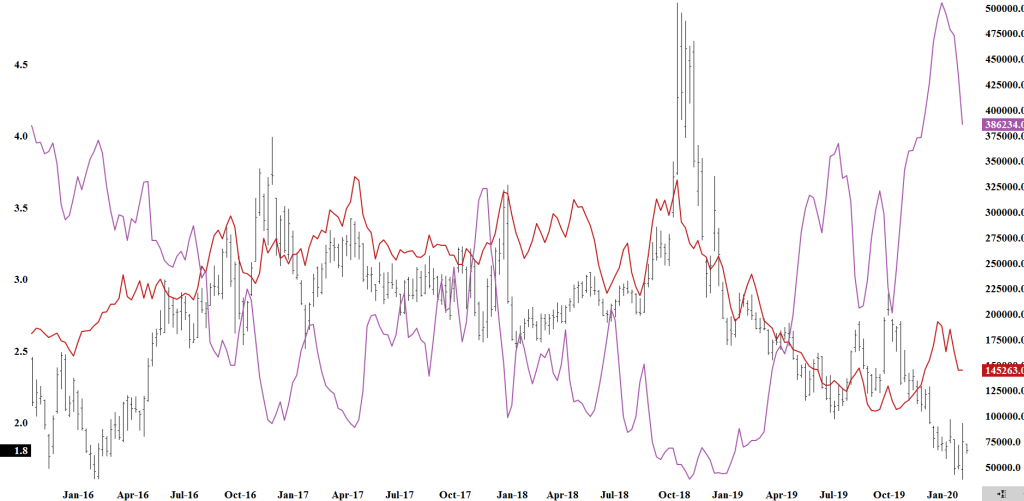
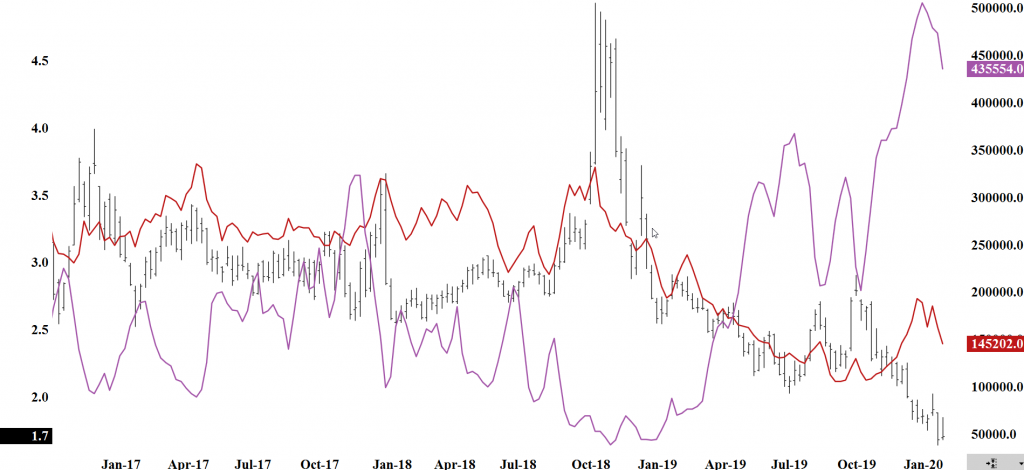
Commodity Futures Trading Commission
Natural Gas Managed Money Long (red) vs Managed Money Short (purple) positions
A serious reduction of the short position from the speculative crowd occurred from March 10th to the 17th and is reflective of the chart above. It should not be construed as the potential for a short covering rally being abated but rather the short speculative sector is reaching the conclusion that significant additional declines is now limited.
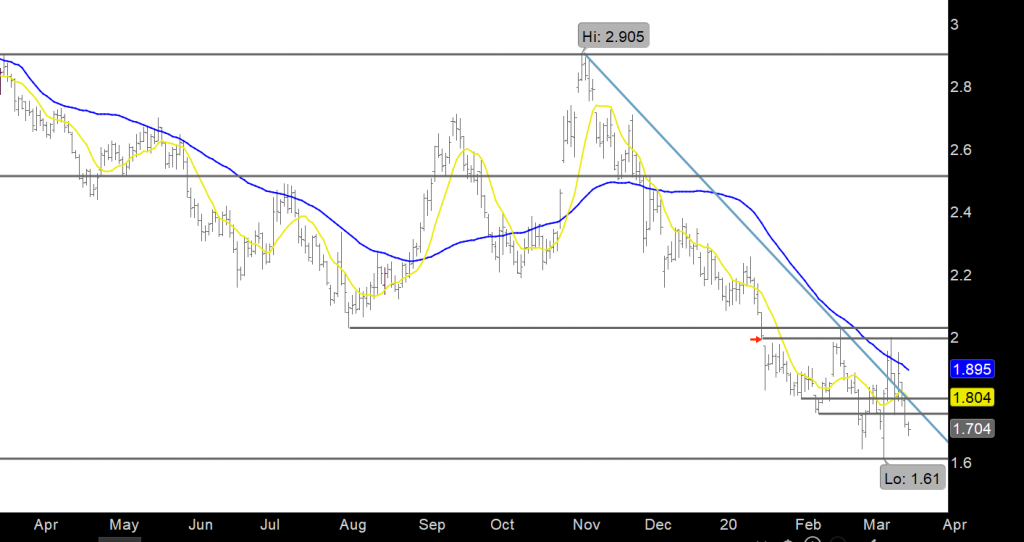
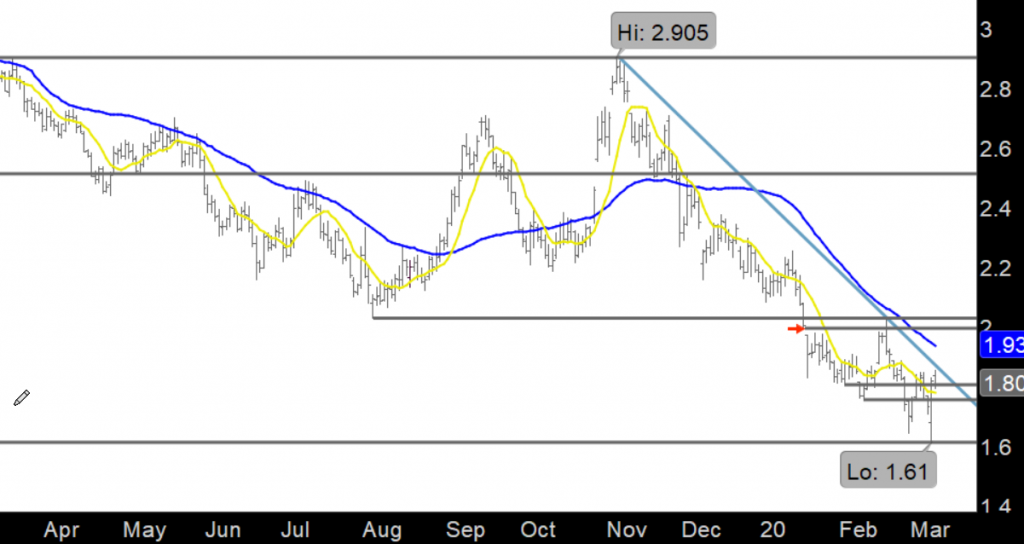
Have been issuing suggestions of playing the range for the last two months and the range has remained between $1.61ish and $2.00ish. That has remained a profitable 20+% range with which to derive revenues if you are a trader. Some fundamental folks don’t understand that trading is different than “a low versus a top”. The bell is not going to ring when the low occurs and everyone jumps in. As discussed on the pay site, this is not likely to be a violent reversal to a bull market, but rather one of tests and steps. Until the break out occurs, play the range.
Major Support: $1.611 Major Resistance: $1.99, $2.029, $2.08-$2.10, $2.34, $2.437, $2.48-$2.52, Minor Resistance: $1.883,
Prices were down, as with all commodities, but the declines in gas were muted as the support displayed last week continues. Continue to play the range for the near term.
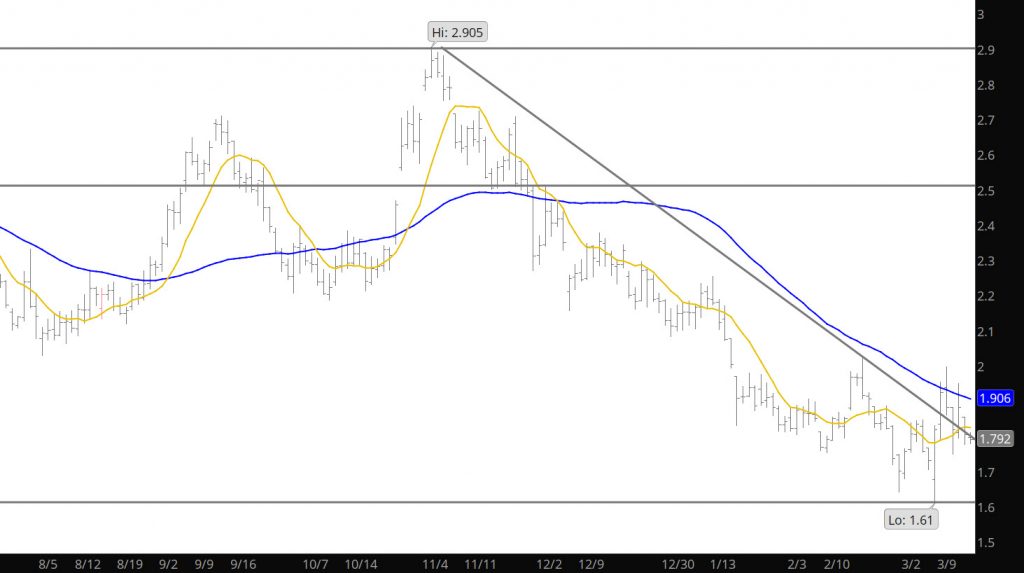
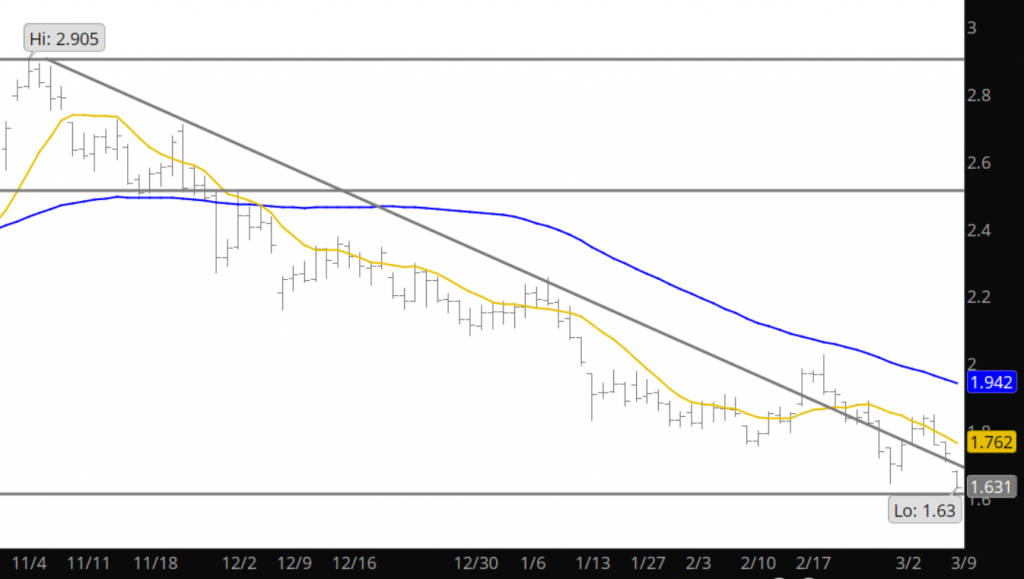
The two charts above are provided to show the damage to the bearish market last week. Natural gas has a history of announcing a change in directional trade with a weekly reversal, accompanied with large volume. That is what happened last week as prices traded a lower low than the previous week and tested the lows from previous years (mentioned in previous postings) at $1.61. From there prices reversed in a large way on Monday and Tuesday (importance of Monday and Tuesday below in CFTC analysis) and traded to a higher high than the previous week on extraordinary volume. Prices closed the week at a higher close than the previous week which confirms a bullish outside week reversal. This is teh second strong signal that prices are in the process of completing a bottom to the trade and long term technical support.
Major Support: $1.611 Major Resistance: $1.99, $2.029, $2.08-$2.10, $2.34, $2.437, $2.48-$2.52, Minor Resistance: $1.883,
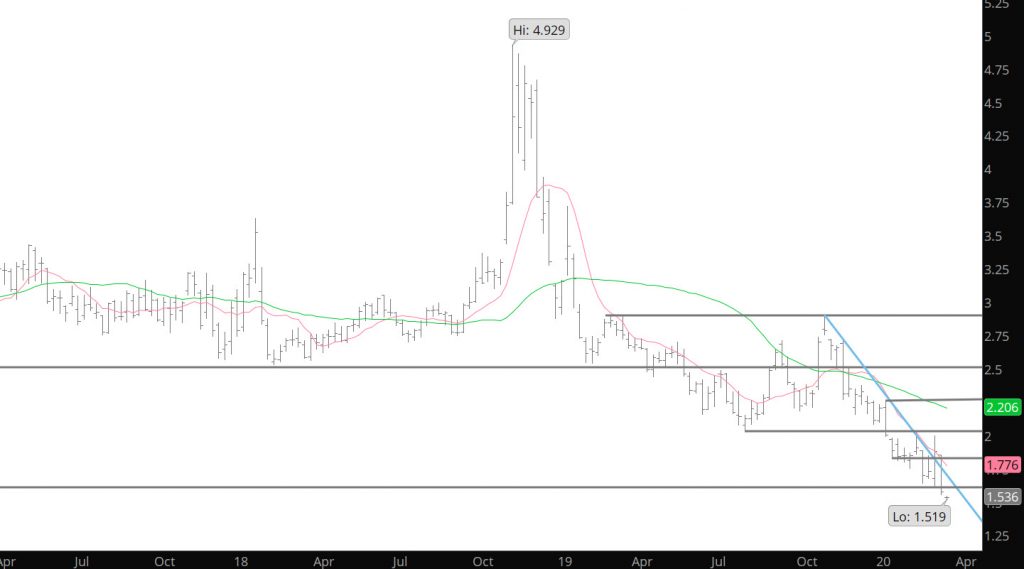
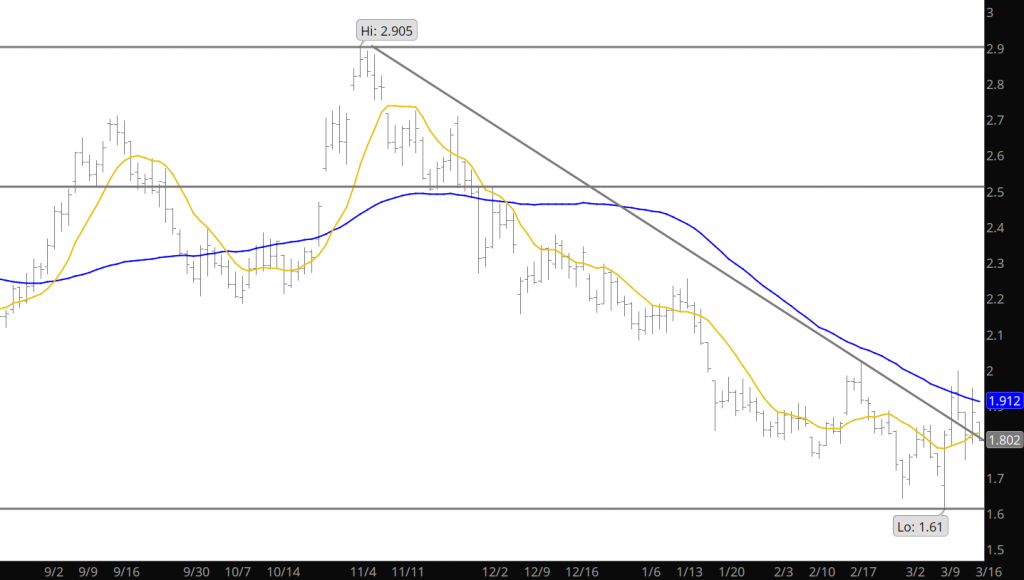
Monthly Contination
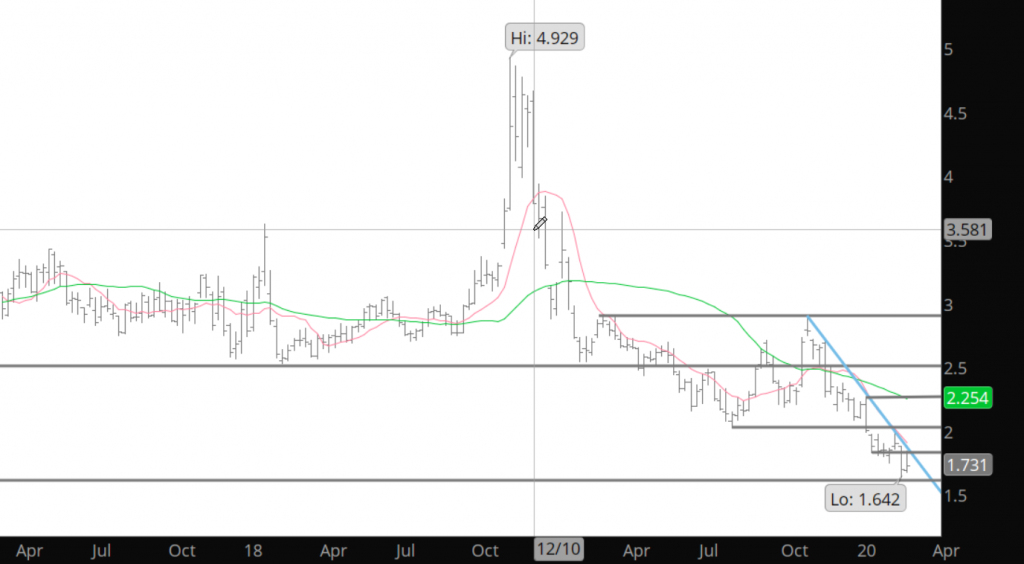
As explained last week –Prices have retraced precisely to support in the Monthly chart above. The average gain from Q1 lows to Q2 highs is nearly 40% over the last ten years. Last year’s run was well below the average, with just a paltry 8% gain. These 2nd quarter gains in price have occurred in various stages of fundamental supply and demand imbalance levels – highlighting the supply situation of this winter may provide a muted impact this year, though the short interest by the speculators may keep this year’s rally well within the historical averages. The potential break-out areas for any rally will be the area of failure last months and the lows from August ’19 which held support from August to January. The lows tested last week at many annual lows seems to confirm long term support.
Commodity Futures Trading Commission
Natural Gas Managed Money Long (red) vs Managed Money Short (purple) positions
The chart above indicates the historical extreme short position and some of the short covering that has commenced and actions last week confirmed the volatility the short covering will provide. Mentioned above that after prices sold down to $1.61 they rebounded and rallied for the next two days. That rally reduced the speculative short position, nearly 50,000 contracts according to the CFTC report released last Friday showing positions as of Tuesday the 10th. That short covering took volume over 878,000 contracts on Monday and and additional 1,039,000 contracts on Tuesday as prices rallied up to $1.95. This represents a somewhat muted short covering rally as discussed in previous weeks– but make no mistake the karma of this market is changing and it only a matter of time until the bias cracks.
Major Support: $1.611 Major Resistance: $1.99, $2.029, $2.08-$2.10, $2.34, $2.437, $2.48-$2.52, Minor Resistance: $1.883,
Last week looked calm from the trade range standpoint, as prices closed the week higher. However, it was a classic outside week reversal for natural gas on significantly higher volume after prices tested the lows (failing to extend lower) from numerous years (discussed on the website). While the range is intact for day trading, it is time start being aware of the issue that the market may be changing its stripes.
Major Support: $1.611 Major Resistance: $1.98, $2.029, $2.08-$2.10, $2.34, $2.437, $2.48-$2.52, Minor Resistance: $1.883,
This range is working out very well for some incremental revenue but eventually it will break — one way or the other. Look for a test of support now that prices rallied $.30 , only to be rejected at resistance. Until then trade the range and garner some light profits.
Major Support: $1.611 Major Resistance: $1.98, $2.029, $2.08-$2.10, $2.34, $2.437, $2.48-$2.52, Minor Resistance: $1.883,
Over the night, prices tested major support from various years and then rallied off those lows. As explained yesterday, continue to work the range and let the prices trade the range until information changes.
Major Support: $1.611 Major Resistance: $1.98, $2.029, $2.08-$2.10, $2.34, $2.437, $2.48-$2.52,
Minor Resistance: $1.883,
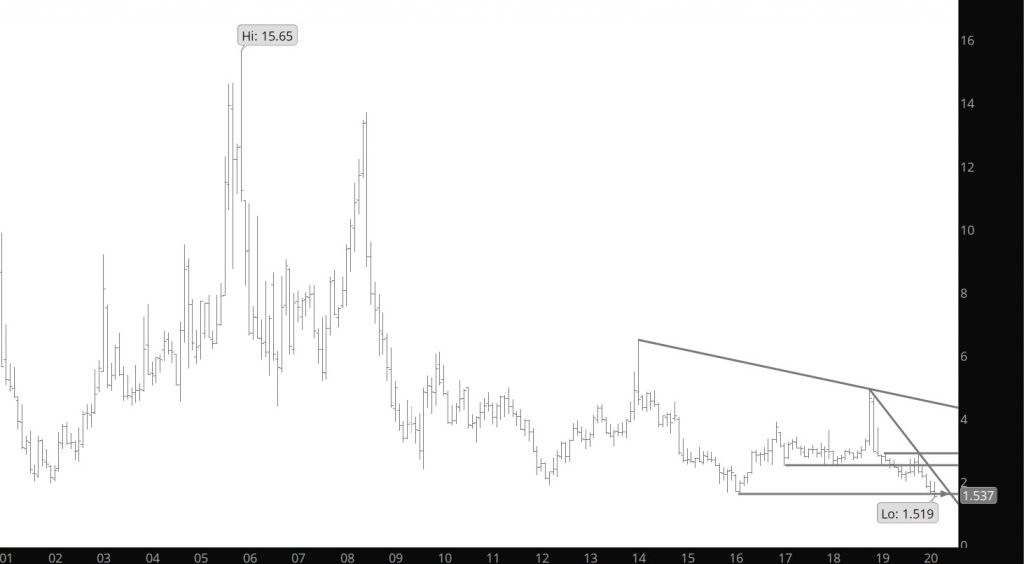
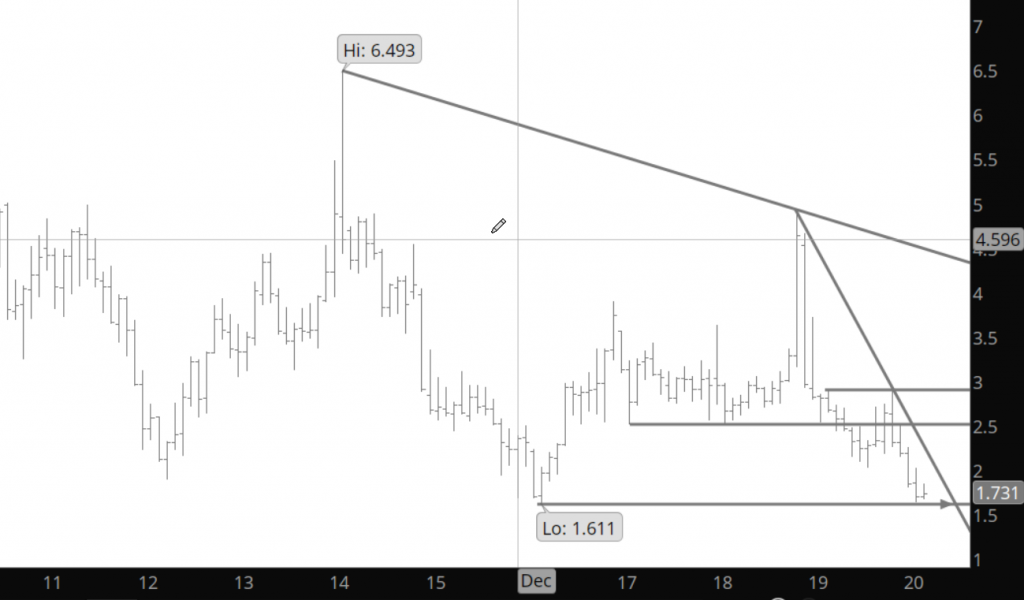
Prices are testing the support from numerous years between 1996 through 1999 and ’10, ’15, and ’16. Have no clue what will happen with all the outside interference from crude and the virus. Will be interesting to witness how the market reacts. From trade perspective, buy support and sell the resistance.
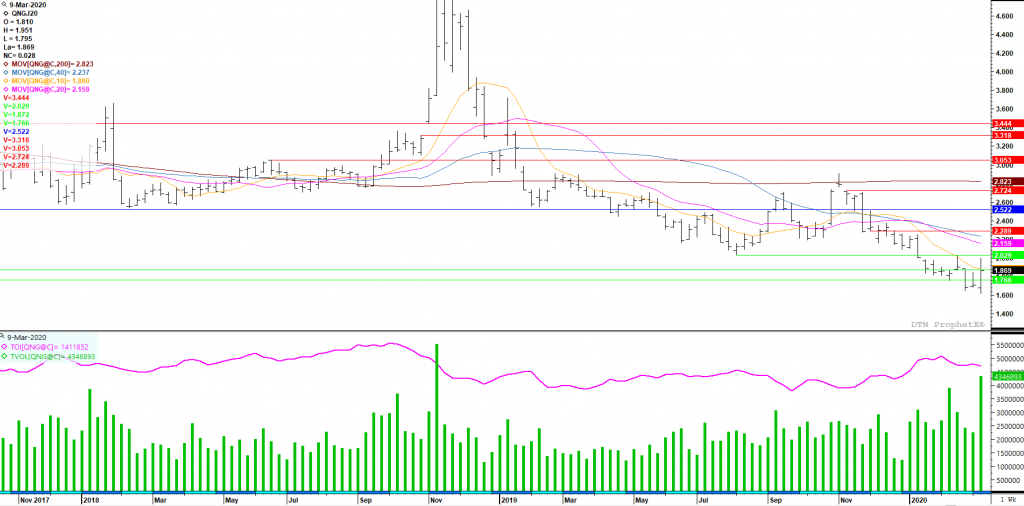
The market remains with a bearish bias. After failing two weeks ago at resistance at $2.029, price have drifted lower as both the speculative long and short traders have been reducing positions (see CFTC data below). Have discussed the history of Nat Gas trading to a low in Q1 of the year and in four of the last ten years the low has occurred in April (slightly beyond the calendar quarter). Currently, support is holding between $1.61 and $1.76 which represents the lows from ’96, ’97, ’98, ’99, ’01, ’15 and ’16. Needless to say, this is a very strong level of support.
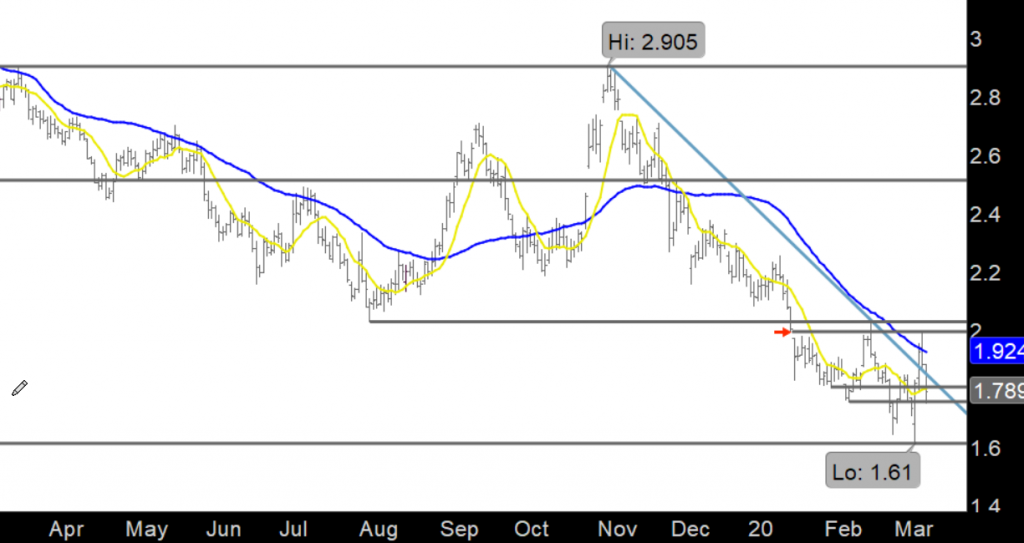
Monthly Contiuation
Prices have retraced to support in the Monthly chart above. As discussed in the Weekly above, how long this support holds (and from where) is the key for the upcoming annual second quarter run for prices. The average gain from Q1 lows to Q2 highs is nearly 40% over the last ten years. Last year’s run was well below the average, with just a paltry 8% gain. These 2nd quarter gains in price have occurred in various stages of fundamental supply and demand imbalance levels – highlighting the supply situation of this winter may provide a muted impact this year, though the short interest by the speculators may keep this year’s rally well within the historical averages. The potential break-out areas for any rally will be the area of failure last months and the lows from August ’19 which held support from August to January. Alternatively, per the Weekly above, declines will start to hit major support areas from many years.
Major Support: $1.753, $1.611 Minor Support: $1.705 Major Resistance: $1.983, $1.994, $2.029, $2.086 Minor Resistance: $2.124
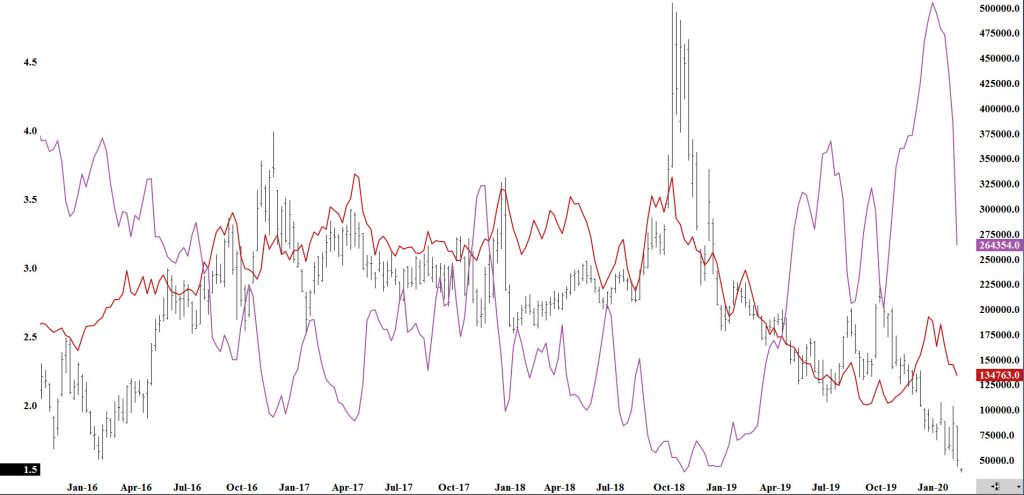
Commodity Futures Trading Commission
Natural Gas Managed Money Long (red) vs Managed Money Short (purple) positions
CFTC Report Dated for Positions on March 3rd
The chart above indicates the historical extreme short position of the speculative component to trade. History warns the traders that such extremes will not last long, though don’t indicate an immediate reversal. Over the last two weeks the short position has been reduced and the effect of the short covering was offset by the Managed Money Long position selling into the short buying. As long as this behavior continues, the expected short covering rally may be more muted than expected. Currently, the market remains under a bearish bias meaning that the short covering rallies may continue to be slow and inconsistent.