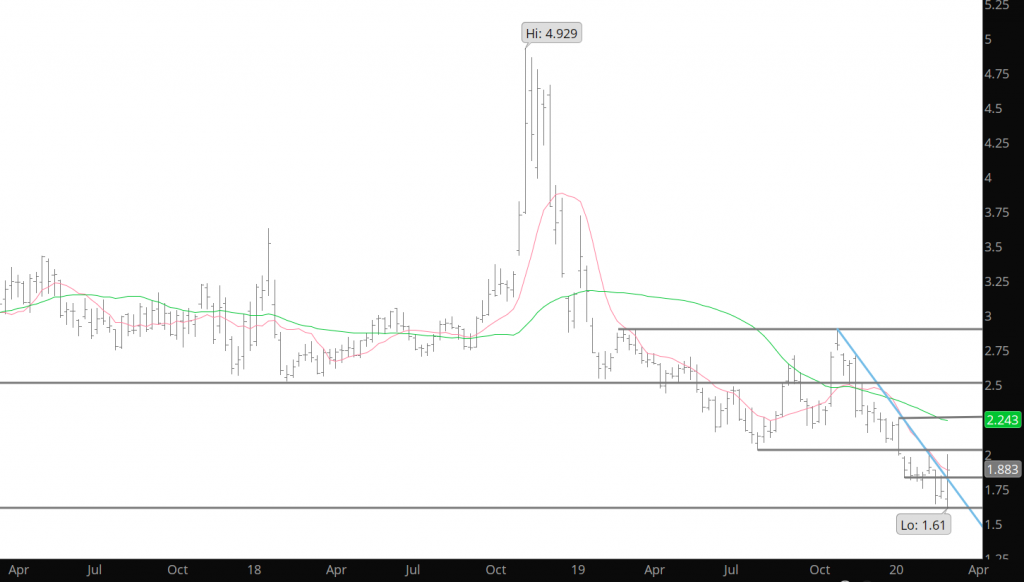
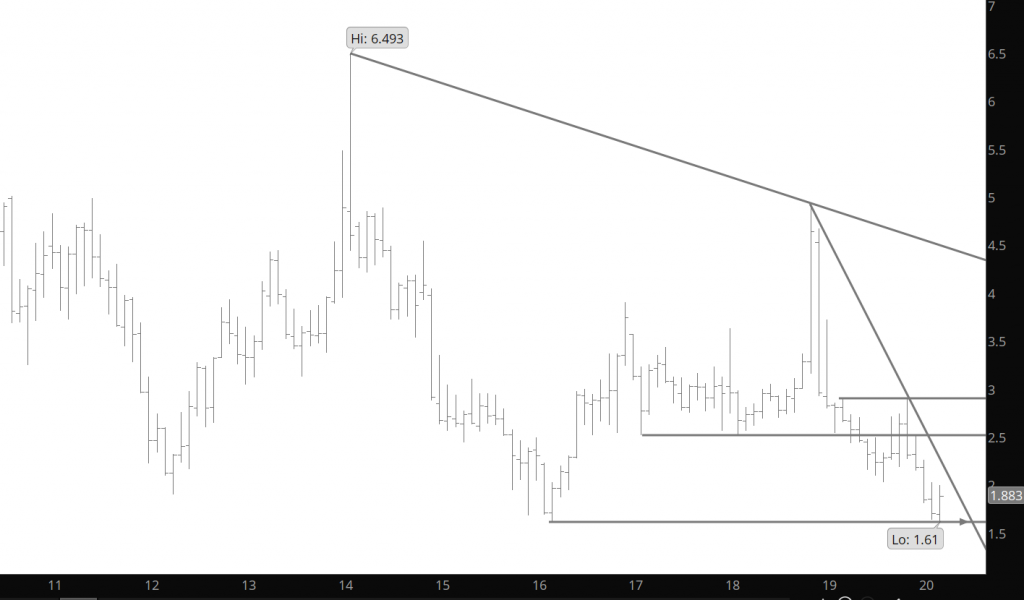
The two charts above are provided to show the damage to the bearish market last week. Natural gas has a history of announcing a change in directional trade with a weekly reversal, accompanied with large volume. That is what happened last week as prices traded a lower low than the previous week and tested the lows from previous years (mentioned in previous postings) at $1.61. From there prices reversed in a large way on Monday and Tuesday (importance of Monday and Tuesday below in CFTC analysis) and traded to a higher high than the previous week on extraordinary volume. Prices closed the week at a higher close than the previous week which confirms a bullish outside week reversal. This is teh second strong signal that prices are in the process of completing a bottom to the trade and long term technical support.
Major Support: $1.611
Major Resistance: $1.99, $2.029, $2.08-$2.10, $2.34, $2.437, $2.48-$2.52,
Minor Resistance: $1.883,
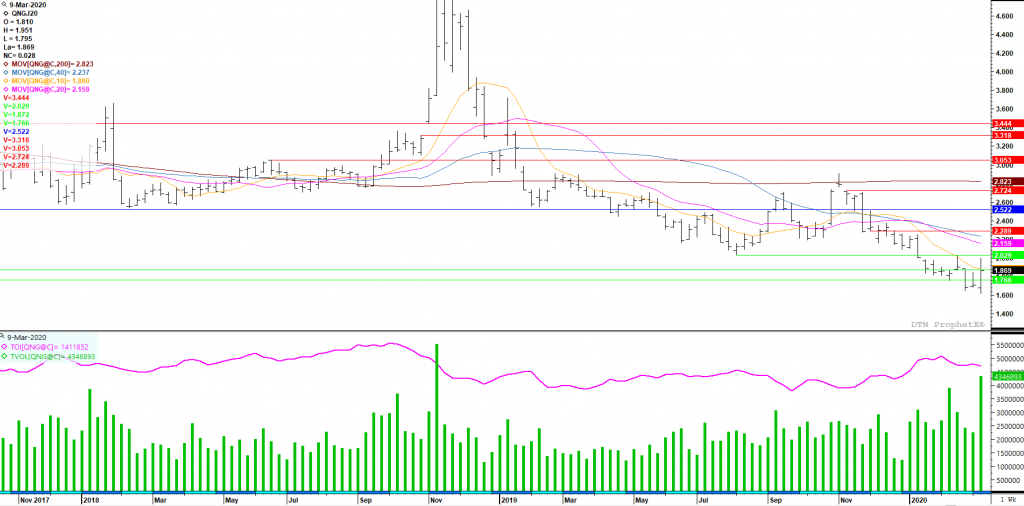
As explained last week –Prices have retraced precisely to support in the Monthly chart above. The average gain from Q1 lows to Q2 highs is nearly 40% over the last ten years. Last year’s run was well below the average, with just a paltry 8% gain. These 2nd quarter gains in price have occurred in various stages of fundamental supply and demand imbalance levels – highlighting the supply situation of this winter may provide a muted impact this year, though the short interest by the speculators may keep this year’s rally well within the historical averages. The potential break-out areas for any rally will be the area of failure last months and the lows from August ’19 which held support from August to January. The lows tested last week at many annual lows seems to confirm long term support.
Commodity Futures Trading Commission
Natural Gas Managed Money Long (red) vs Managed Money Short (purple) positions
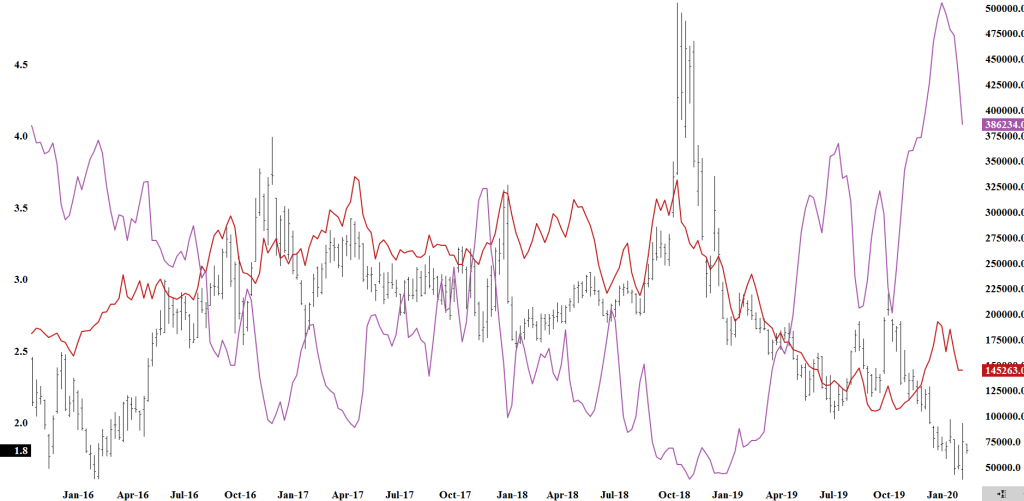
The chart above indicates the historical extreme short position and some of the short covering that has commenced and actions last week confirmed the volatility the short covering will provide. Mentioned above that after prices sold down to $1.61 they rebounded and rallied for the next two days. That rally reduced the speculative short position, nearly 50,000 contracts according to the CFTC report released last Friday showing positions as of Tuesday the 10th. That short covering took volume over 878,000 contracts on Monday and and additional 1,039,000 contracts on Tuesday as prices rallied up to $1.95. This represents a somewhat muted short covering rally as discussed in previous weeks– but make no mistake the karma of this market is changing and it only a matter of time until the bias cracks.