Consolidation of the Gains

Daily Continuous

Prices backed off the recent run after the open, then rallied just after the storage release, only to retrace into the close. This type of price action was to be expected (suggested) after the short covering was finished. The limits of short covering is explained with the reduction in volume (daily but will be huge for the week) and now the market needs to prove that the rally has “legs”. A retracement of prices back to $2.10-$2.05 and then finding support will be helpful in defining how strong the foundation of this rally will be heading into a historically weak period for prices seasonally.

Major Support: $1.893,-$1.86, $1.527, $1.484-$1.44, $1.336
Minor Support: $2.167, $2.102, $2.055, $1.975, $1.719
Major Resistance: $2.255, $2.43
Minor Resistance:

To read The Daily Call you must be a subscriber (Current members sign in here. ) Start your subscription today.

Slow Down in the Gains

Daily Continuous

Prices tried to rally up another $.06 before running into selling at resistance from the Jan ’20 high at $2.255. From there, consolidation started and price broke down to the high teens before the close. Would continue to expect some consolidation of the run this week and we do have a storage report to work with.

Major Support: $1.893,-$1.86, $1.527, $1.484-$1.44, $1.336
Minor Support: $2.167, $2.102, $2.055, $1.975, $1.719
Major Resistance: $2.255, $2.43
Minor Resistance:

To read The Daily Call you must be a subscriber (Current members sign in here. ) Start your subscription today.

Extension Higher

Daily Continuous

Unlike May, when prices rallied on the pipeline break only to retrace the next day, yesterday’s action showed an extension of the gains from Monday. The recent strength in prices may not be going away, but we will see. Momentum indicators, short term, are reaching over-bought levels but longer term are not there yet. Yesterday’s low, early morning low, reached 38% retracement of the Monday gains, but found buyers. That area will now become minor support.

Major Support: $1.893,-$1.86, $1.527, $1.484-$1.44, $1.336
Minor Support: $2.102, $2.055, $1.975, $1.719
Major Resistance: $2.255, $2.43
Minor Resistance:$2.164

To read The Daily Call you must be a subscriber (Current members sign in here. ) Start your subscription today.

Whoa Didn’t Expect That

Daily Continuous
September Spot

As you know, I have been expecting some sort of break out based upon technical conditions — but I did not expect that type of run. Taking price up to the highs from My (after hours) only to find selling once again. Have little knowledge as to what prompted this run, (pipeline explosion happened in May) so the folks trading have heard or seen data that wants them to cover short positions. Yesterday’s gains took prices three standard deviations over the 20 week SMA which is not sustainable over time — so the market should consolidate the gains or the market will just collapse into the range as it did last May. The rest of the week is a key time for the market going into winter. Due to the failure of prices to extend beyond the 200 day SMA in the Sept chart there is a clear area of resistance– now we have to define the support zones that will hold the gains.

Yesterday’s gains went above the 200 day SMA (Sept contract) briefly on to retrace some of those gains and then in the post outcry session took prices back above only to retrace. Is the market taking advantage of the rally to re-establish short (per May rally) or is this a sea change.

To read The Daily Call you must be a subscriber (Current members sign in here. ) Start your subscription today.

September Fall Back Into the Range

Weekly Continuation
Monthly Continuation

Prices traded back to 1.714 before the expiring August prompt rallying to nearly early July high (1.893 v 1.924) but then fell to expire at 1.854. From there the September contract immediately opened with a gap only to trade slightly above the August, in July, (1.928 v 1.924) failing and gave back the premium it was afforded, trading back into the common range that has held the market for recent months. It ended the outcry session nearly where the August had begun it (1.799 v 1.796). The reversal may indicate the difficulty that the September contract will face in breaking out.

It was interesting that the contract ended the outcry below the trend line on the Weekly, only to bounce before the close of the week, closed nearly on the trend line. Until the prompt gas closes the week above that trend line (from the Nov ’19 high and the May ’20 high), supported by higher volume and gaining open interest, it is likely that prices will remain in this range.

To read The Daily Call you must be a subscriber (Current members sign in here. ) Start your subscription today.

Does the Recent Tendency Hold

Daily Continuation
Spot September Contract

As discussed in the Weekly section, September gave up the premium afforded it as prompt quickly last week. The declines continued into the recent range, closing the outright contract below the critical trend line, but when the trade continued prices had rebounded $.02 by the end of the trade day, closing just below this critical trend line. The tendency for the last three weeks, have been Monday’s showing a decline.

We should get a great indication of whether the bias in this market is changing (per the Weekly section) during the coming couple of weeks. Last week occurred on lower volume and a slight gain in open interest, but according to the CFTC report showing positions as of the 28th, Managed Money short positions have been reduced 11,245 contracts while the the Managed Money long positions had increased 7,294 contracts– the speculators seem to be changing there bias.

To read The Daily Call you must be a subscriber (Current members sign in here. ) Start your subscription today.

Strong Finish To a “Building” Trade

Daily Continuous

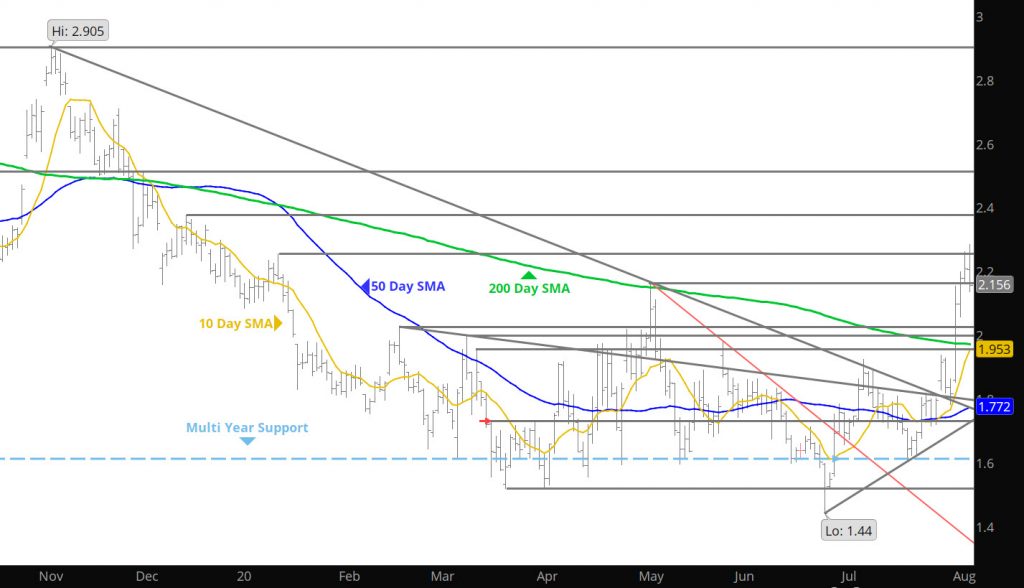
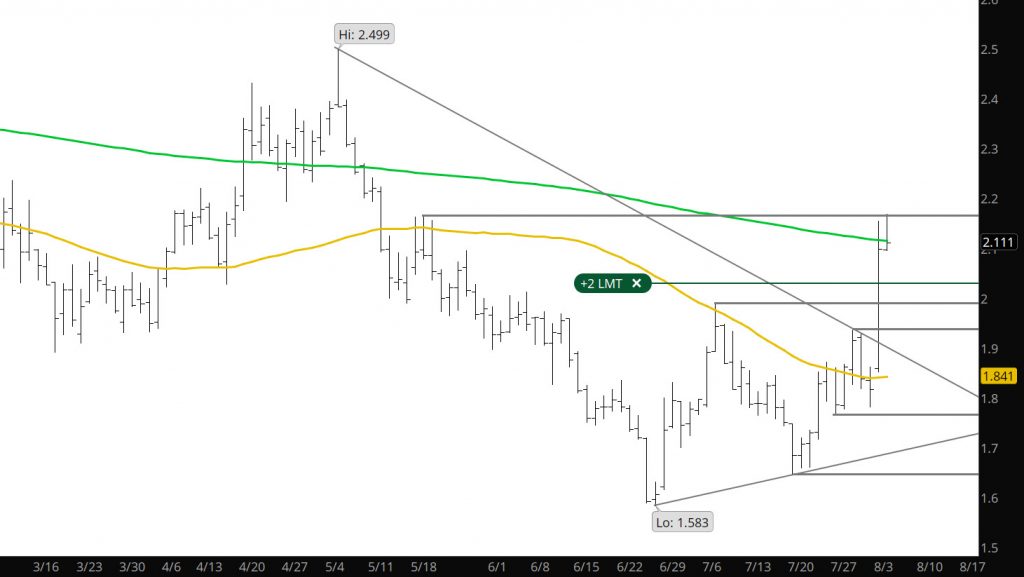
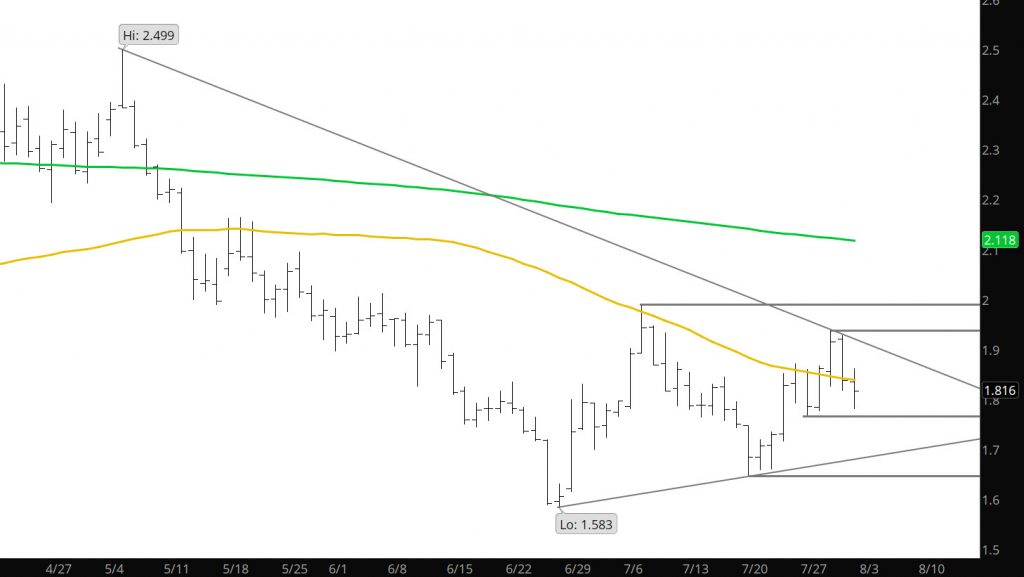
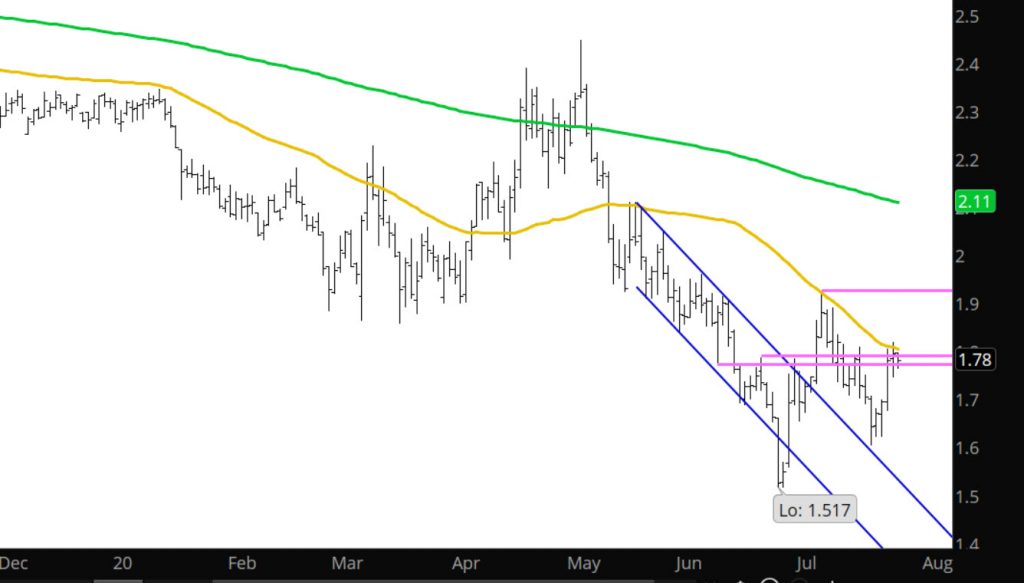
As discussed in the Long Term area of the web site, prices are behaving a little differently recently. I would guess there are fundamental reasons for this, though that confuses me as the market is still long storage etc., but there has been a shift in the trade habits lately. Caution though, as it remains in a range environment and should be traded accordingly. It is now approaching serious resistance and this behavior will indicate potential future expectations.

Major Support: $1.527, $1.484-$1.44, $1.336
Minor Support: 1.893- $1.854, $1.719
Major Resistance: $1.924-$1.956, $1.974-$1.976, $1.989
Minor Resistance:

Weekly Similarities Continue

Daily Continuous

The similarities to previous weeks continues as price found a bid and erased the previous day’s losses. This market is starting to “feel” different as prices decline and support arrives, which is much different than one or two months ago, where declines were piled into. It remains a range market and should be respected as such.

Major Support: $1.484-$1.44, $1.336
Minor Support: $1.527
Major Resistance: $ $1.864-$1.896
Minor Resistance:

To read The Daily Call you must be a subscriber (Current members sign in here. ) Start your subscription today.

Monday Trend Continues

Daily Continuous

Spot August

For the third consecutive week prices want to start lower. Last week the low surge formed a reversal discussed in the Long Term section of the web site. Not sure what this week will bring, but as discussed in the Long term section there may be a slight bias change going on. For now, daily traders have to respect the range trade we are in and trade accordingly. This week has an expiration which will provide addition information — check the long term during the week to ascertain any changes that I see from a technical perspective.

To read The Daily Call you must be a subscriber (Current members sign in here. ) Start your subscription today.

Shifting a Bias –Perhaps

Weekly Continuation
Monthly Continuation

Further evidence occurred last week with gas that there may be a gradual bias shift headed in the near future. Prices opened the week lower and formed a higher low than June’s only to reverse and trade higher for four consecutive days. The rally briefly trade above the previous week’s high but closed the week just above the previous week for a classic outside week reversal. This action was accompanied with higher volume and gains in open interest for the week — both technically supportive indicators.

Momentum indicators are starting to provide a bullish “divergence” for gas as they never confirmed the June low (July expiration) and it is looking like the August expiration will unlikely follow the similar pattern as July’s expiration.

To read The Daily Call you must be a subscriber (Current members sign in here. ) Start your subscription today.