To read The Daily Call you must be a subscriber (Current members sign in here. ) Start your subscription today.
Author: Willis Bennett
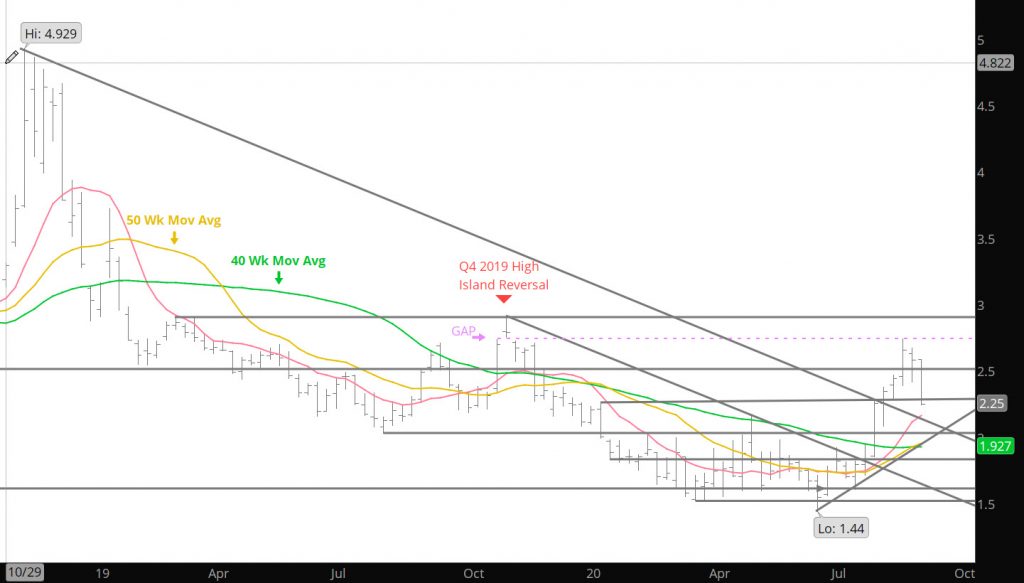
Great Consolidation Pattern

To read The Daily Call you must be a subscriber (Current members sign in here. ) Start your subscription today.
Solid Consolidation

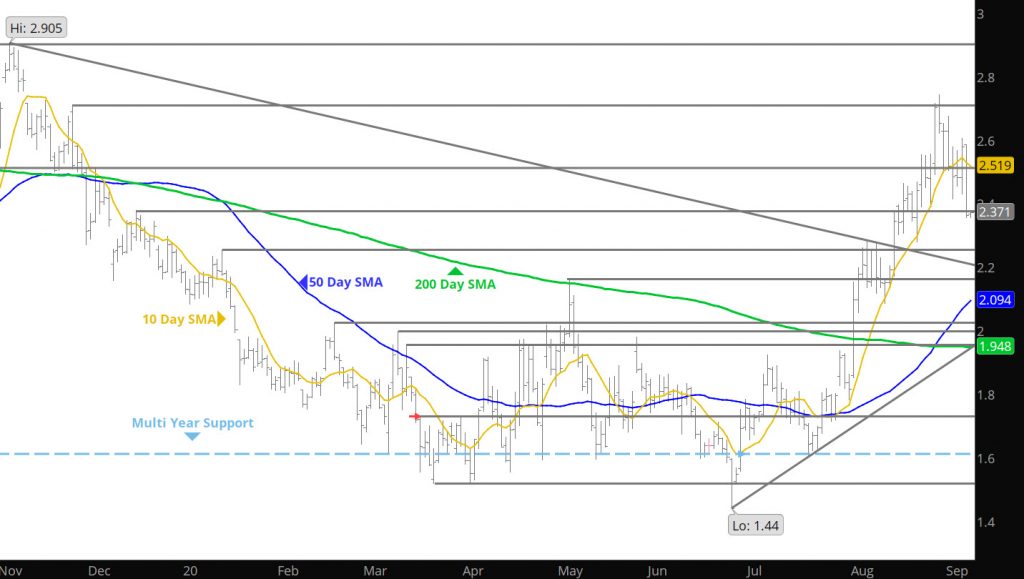
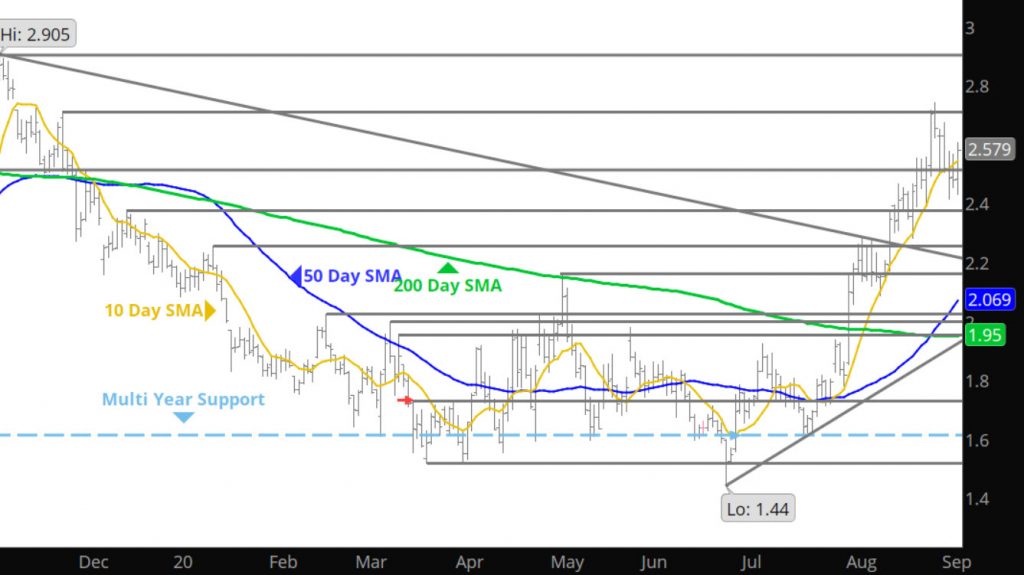
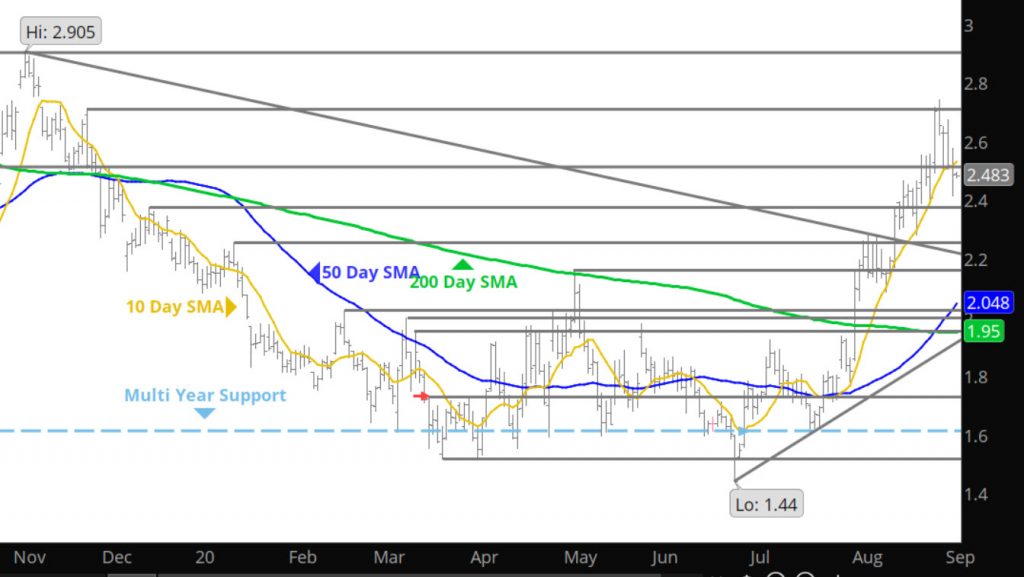
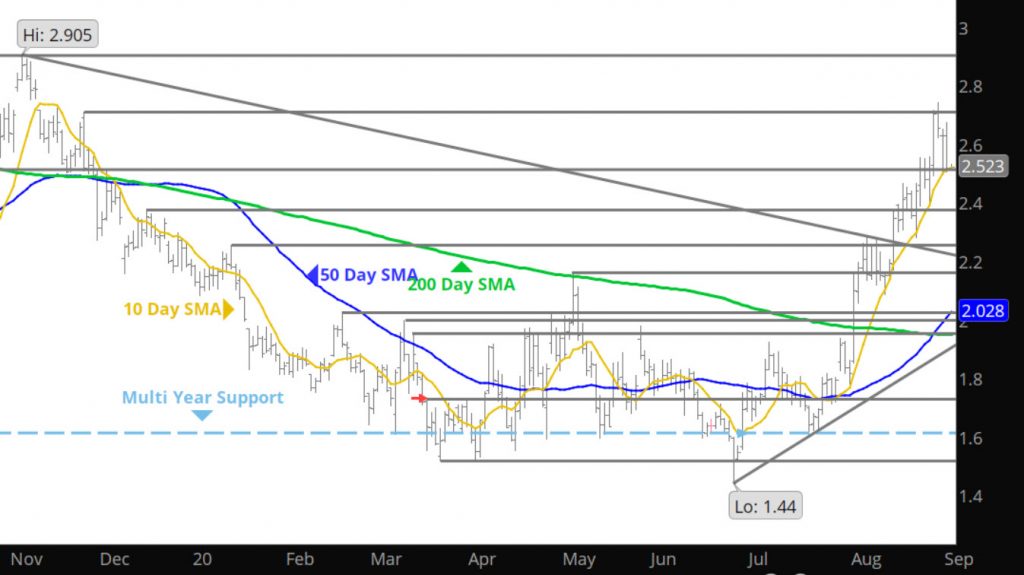
Continued consolidation of prices has taken prices off the over bought levels and now sit at some very normal zones. There are two ways of correcting over bought conditions and one is a major correction, the other is time. It looks like the current market is utilizing time for the correction to the over bought status. Continue to play the current range from $2.35-$2.50 until the market explains further intentions.
Just and FYI take a look at the Weekly section as I expand on the year of 2002 that I hinted to yesterday.
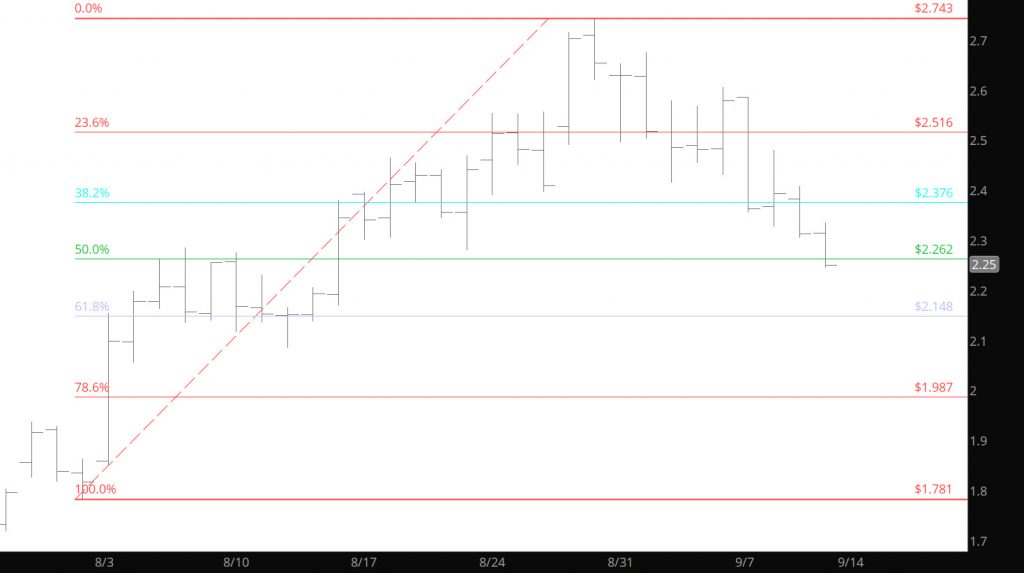
Major Support: $2.38-$2.415, $2.186, $2.162, $2.089-$2.055, $2.029-$1.937, $1.86, $1.527,
Minor Support: 2.377, $2.28, $2.255, $2.195, $2.102, $1.975
Major Resistance: $2.743-$2.755, $2.809 Minor Resistance:$2.49-$2.51, $2.56
Looking At History
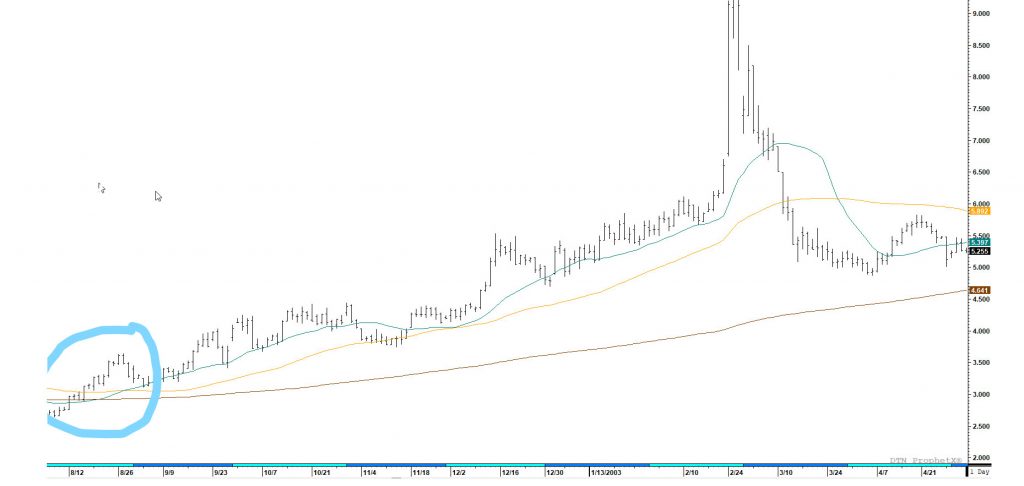
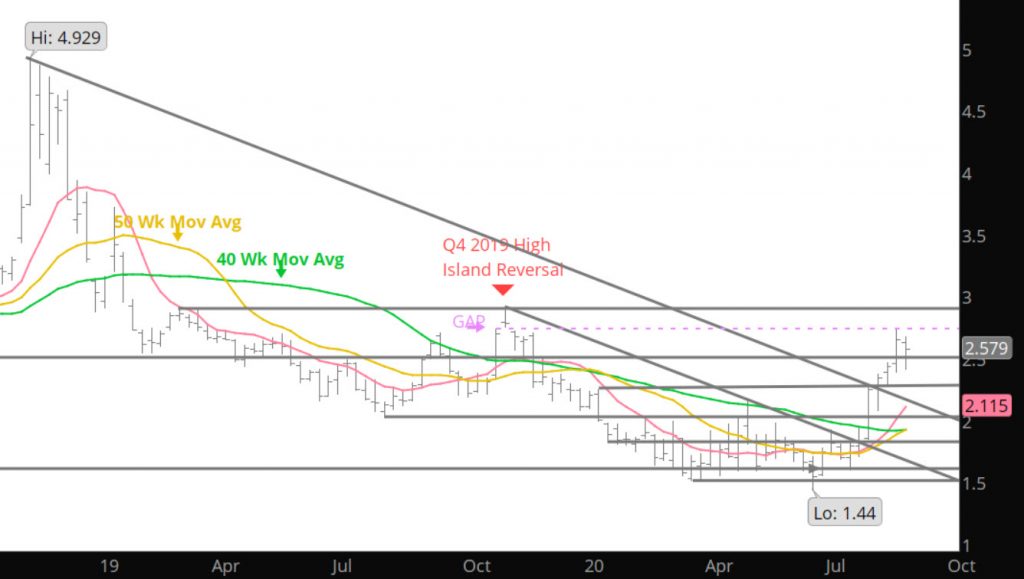
Highlighted three years that prices stayed strong during August, but I wanted to focus on 2002, as the spread between October and November expanded to over $.40 in early September, which is similar to this year.
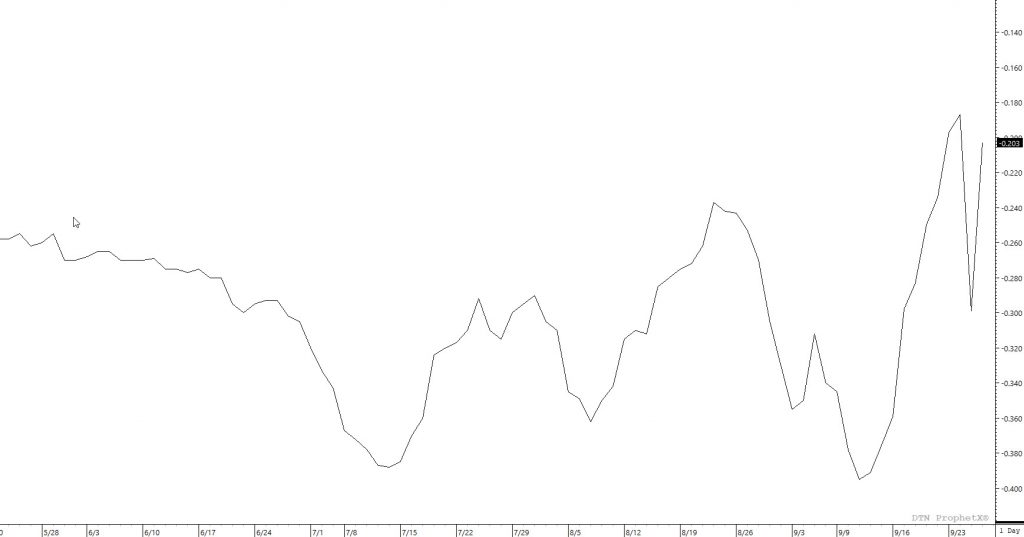
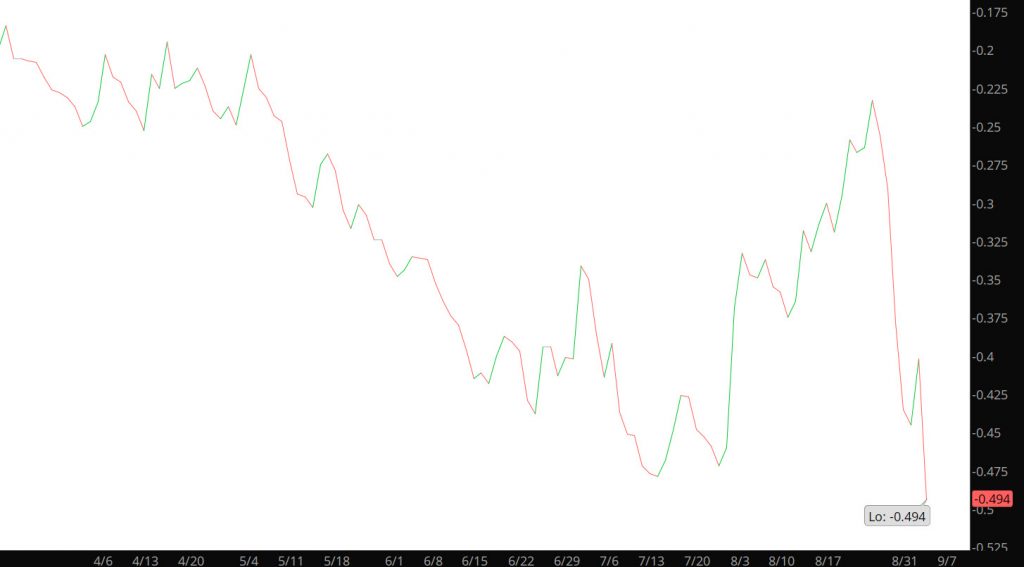
Notice that the solid gains during the August month in 2002 (blue circle), prices then retracted 14.6%, before extending on a long term rally that didn’t conclude until February ’03. While that started, the spread between Oct and Nov contracts expanded to $.40 (premium Nov) during early Sept. Similar to the current year, prices held firm all during the August trade and currently trade $.45 differential to the November contract. The recent declines from the highs at $2.743 have corrected 14.7% at the lows yesterday. In 2002, the market did not correct until Feb 2003 as prices skyrocketed. Not sure if this occurs in 2020 but wanted to bring history to your attention.
Differed Contracts Remain Powerful
To read The Daily Call you must be a subscriber (Current members sign in here. ) Start your subscription today.
As Expected, Seasonal Weakness Rhymes
To read The Daily Call you must be a subscriber (Current members sign in here. ) Start your subscription today.
Market Continues Consolidation
To read The Daily Call you must be a subscriber (Current members sign in here. ) Start your subscription today.
Does History Rhyme or Not
To read The Daily Call you must be a subscriber (Current members sign in here. ) Start your subscription today.
Solid Test of Support — Nice Rally Failure
To read The Daily Call you must be a subscriber (Current members sign in here. ) Start your subscription today.
Repeat?
To read The Daily Call you must be a subscriber (Current members sign in here. ) Start your subscription today.