To read The Daily Call you must be a subscriber (Current members sign in here. ) Start your subscription today.
Daily Call
No Tranquility Here
To read The Daily Call you must be a subscriber (Current members sign in here. ) Start your subscription today.
Calming Trade
To read The Daily Call you must be a subscriber (Current members sign in here. ) Start your subscription today.
Another Big Rally
To read The Daily Call you must be a subscriber (Current members sign in here. ) Start your subscription today.
Prices Extend Gains

To read The Daily Call you must be a subscriber (Current members sign in here. ) Start your subscription today.
Not Extended Yet
To read The Daily Call you must be a subscriber (Current members sign in here. ) Start your subscription today.
Interesting Day of Trade

To read The Daily Call you must be a subscriber (Current members sign in here. ) Start your subscription today.
Prices Continue Higher
To read The Daily Call you must be a subscriber (Current members sign in here. ) Start your subscription today.
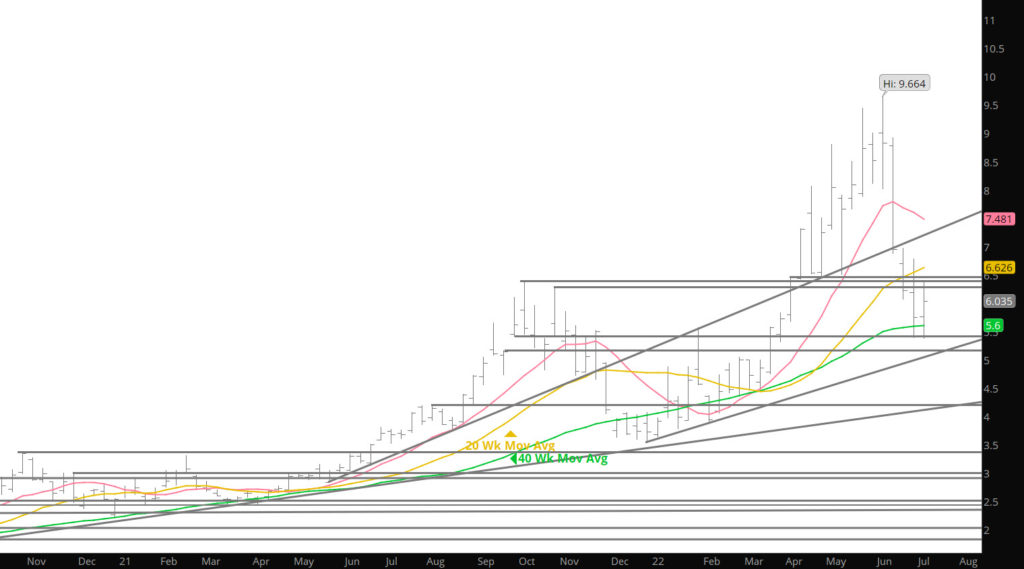
Support Tested
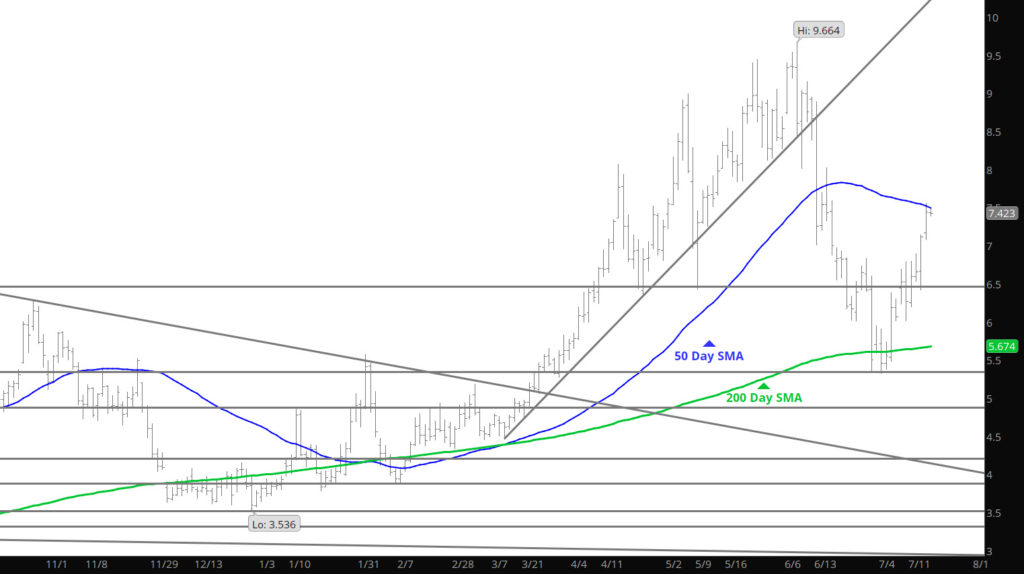
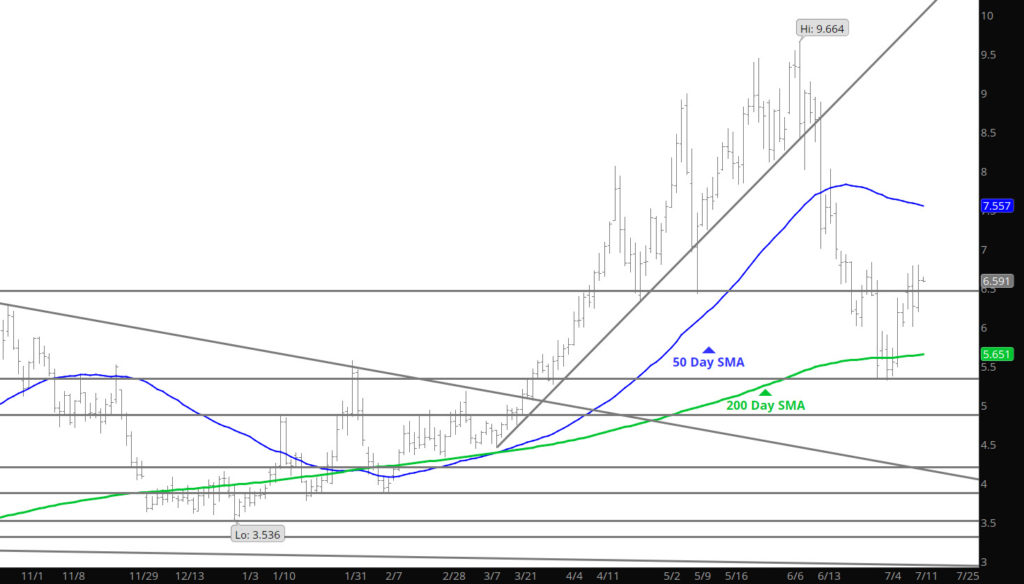
Prices did not rally quite as high as expected but the run failed (as expected) and immediately fell to test support at $6.00. That area has now held in the last three declines trying to break below. Accordingly, this price action should be respected as an area where buyers come in. As discussed previously, the market may be setting up a summer trading range (basically between $5.50 and $7.00) for prompt until the summer heat gets defined and the LNG plant issue becomes clearer. Until then play the market you are given.
Major Support:$6.02, $5.623, $5.59-5.572, $5.06
Minor Support: $5.548, $5.40-$5.45
Major Resistance: $6.34-$6.43, $6.587, $6.638
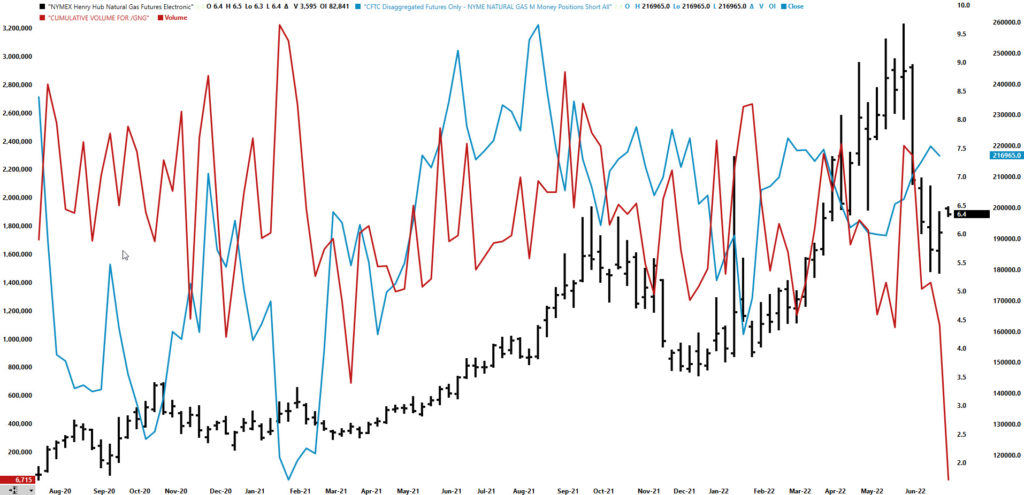
Too Many on One Side
To read The Daily Call you must be a subscriber (Current members sign in here. ) Start your subscription today.