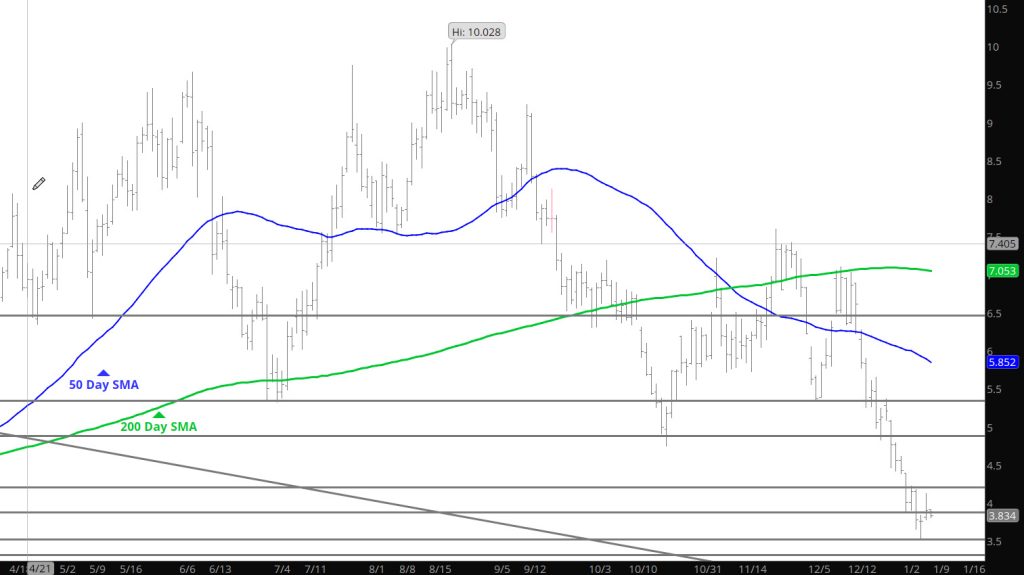
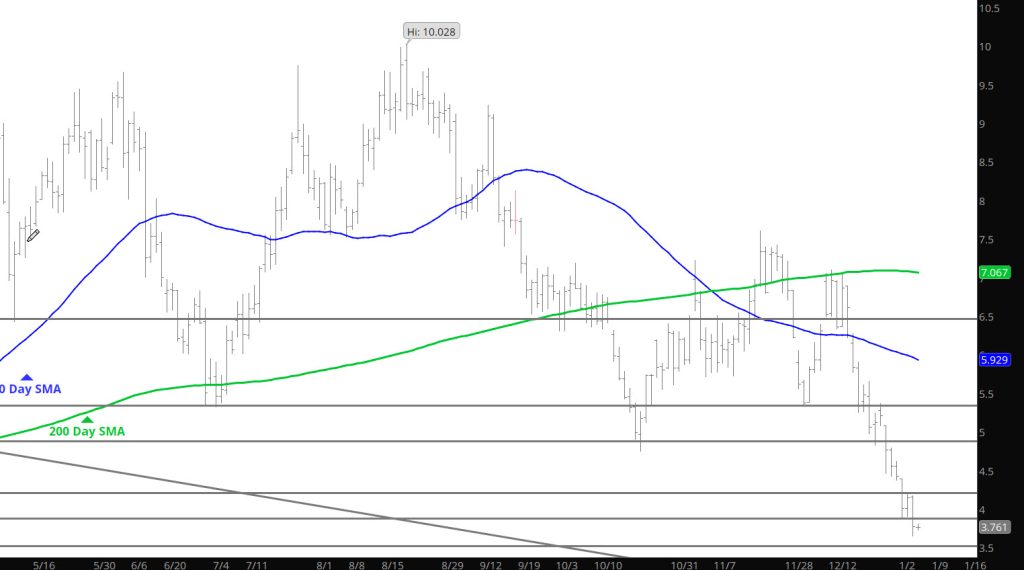
Yesterday’s action was a start to a corrective rally to relieve the over-sold conditions– now the market is likely to range trade to further allow the market to create a base from which to rally from or extend the declines. Due to prices declining at the end of the day — expect them to add to weakness today.
Major Support: $3.638 Minor Support: Major Resistance$4.22-$4.39, $4.75-$4.825, $4.948, $5.056
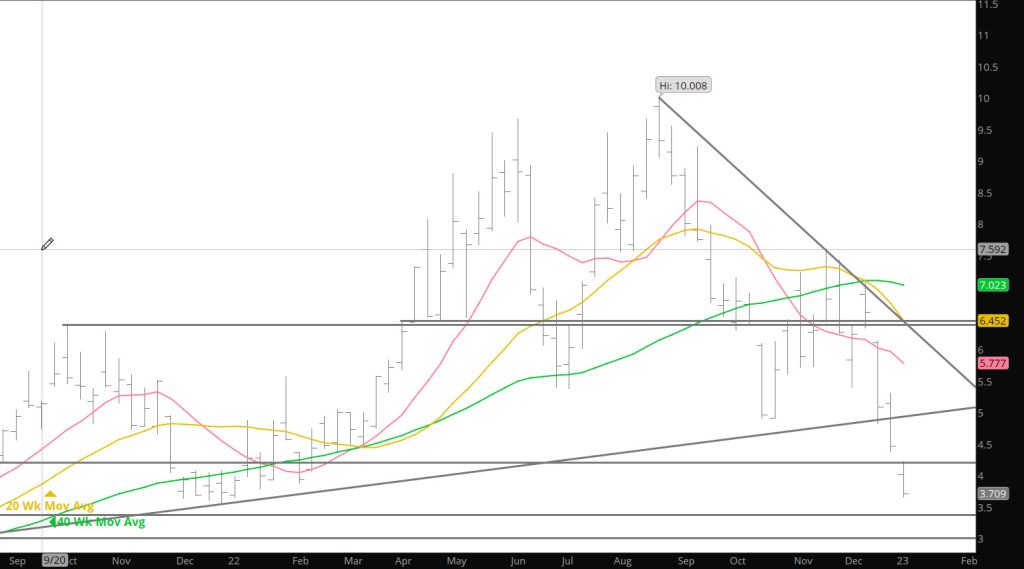
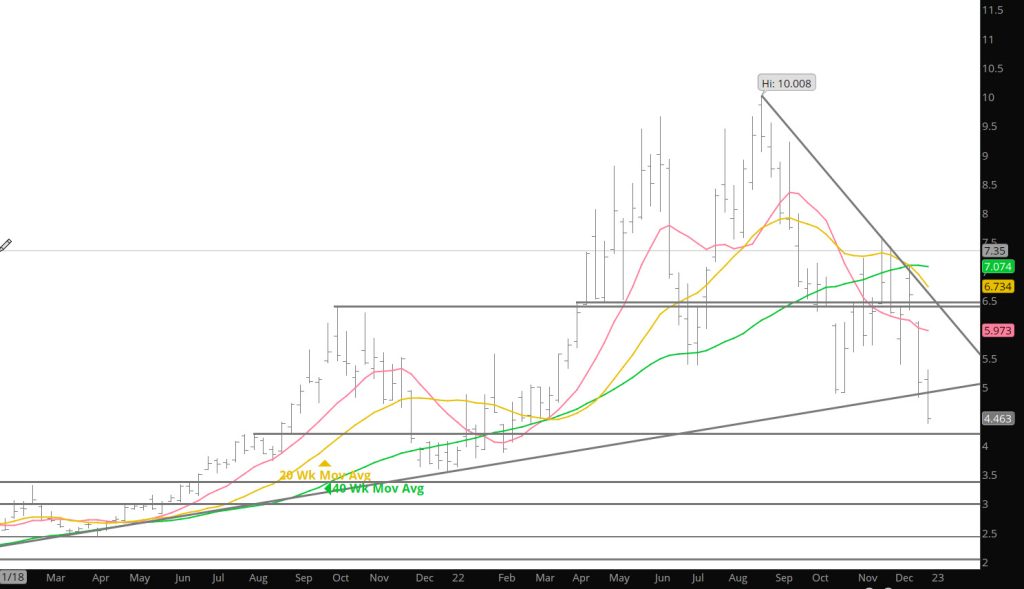
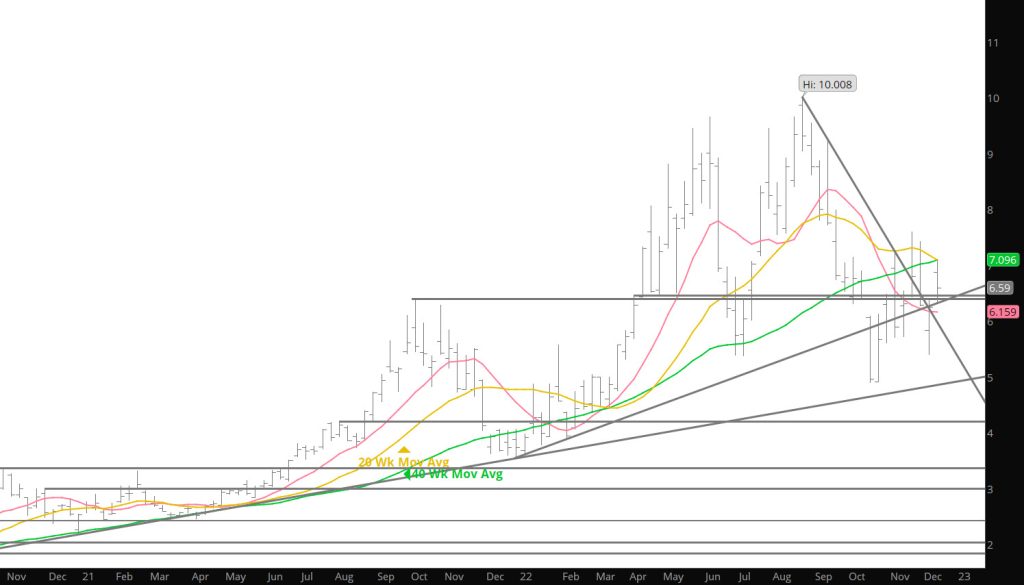
The uptrend that first began following the June ’20 low, was conclusively ended when the calendar December close for prompt gas was below the trend line drawn from that multi – year low and the December ’21 low (See Monthly Continuation chart above). That does not mean that the gas market is headed to zero or even back to test the last multi – year low, but the downside momentum that began to be generated by the bearish momentum divergences that accompanied the August high is likely to take some time to be completely neutralized. While it may not seem so, price volatility has actually decreased…the weekly ATR (the average range of the last fifteen weeks) has fallen from $1.413 on 07/29 to $1.091, over the last few weeks from $1.155. This week’s range was $.874 the narrowest since mid – November.
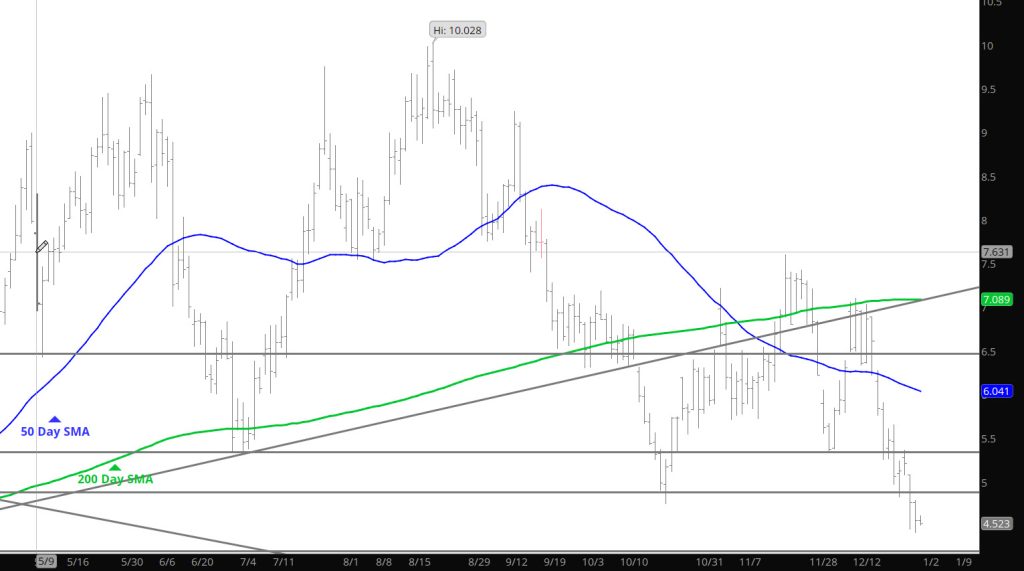
That said, a volatile rally is overdue. Over the last four weeks since the seasonal early – mid December high on 12/13, prompt gas has fallen from $7.105 to $3.520 (over 50%). In the process the gas market has finally reached an extremely oversold technical level. The weekly RSI ended the week at 24.29 that has the “leading” indicator, lower than that for one week during October, which was followed by a weekly reversal and a rally from $4.750 to $7.604.
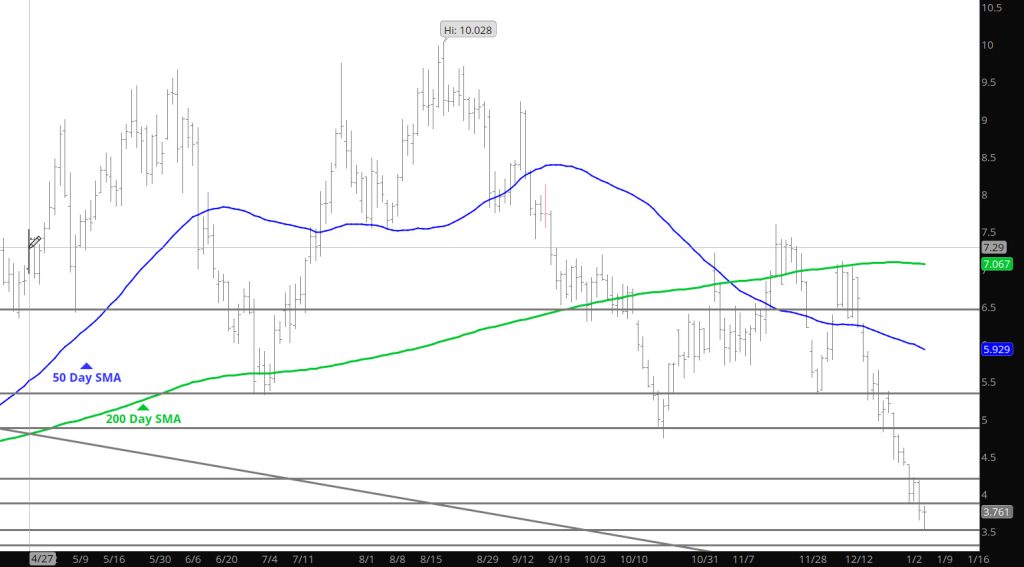
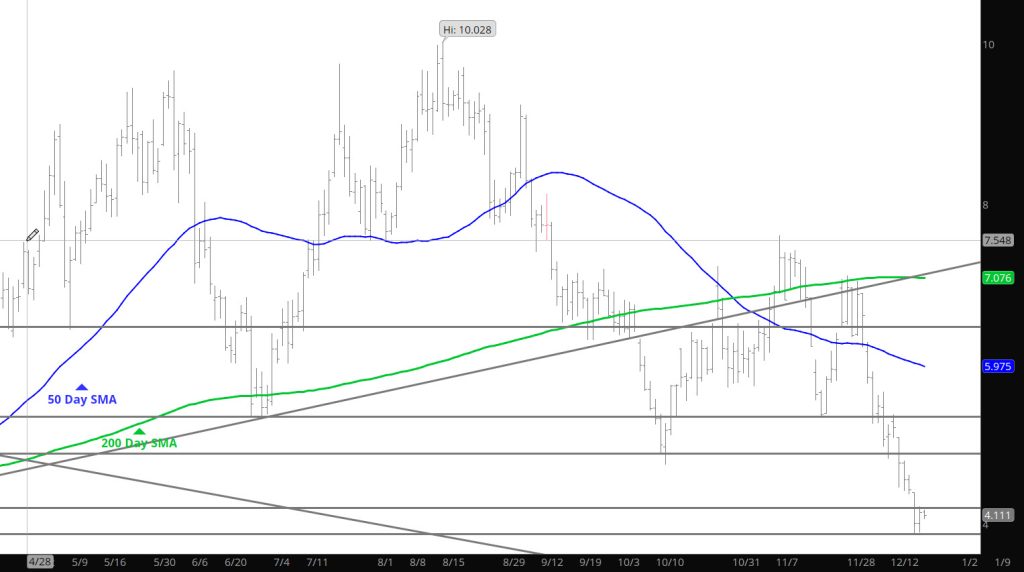
The dramatic declines of the last few days, have left prices entering the extreme zone of over sold. Not saying it can’t decline more — just warning that additional declines are likely to to be short in extensions (see Weekly section). Would allow for the rebound that will be coming, at some point, before entering new short positions.
Major Support: $3.638 Minor Support: Major Resistance$4.22-$4.39, $4.75-$4.825, $4.948, $5.056
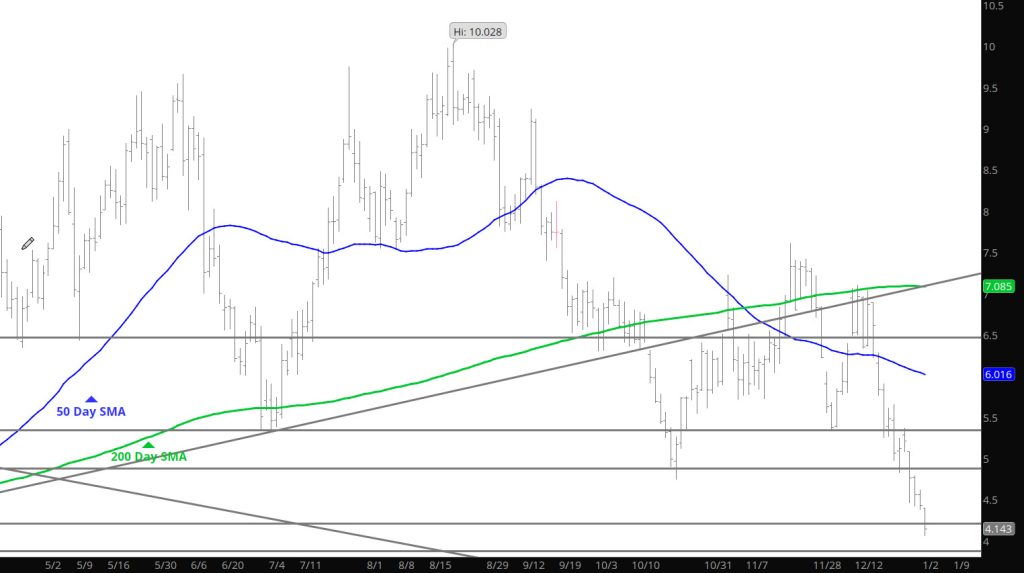
As a trader, the cliff that the market has fallen off of is impressive (see chart) but also not sustainable over the near term as the market clearly is approaching extreme over sold levels. Having profited nicely on these declines, greed usually catches me under-prepared and over-confident. RSI indicators on both the weekly and daily charts are entering extreme zones and the weekly chart is now trading over 2 standard deviations below the 20 week moving average– all warning signs that it may be time to take profits as I doubt they will be giving gas away free in the current year.
Major Support: $3.638 Minor Support: Major Resistance$4.22-$4.39, $4.75-$4.825, $4.948, $5.056
As mentioned in the Tuesday Daily, prices seemed destined to test some of the lows from December ’21 and that is what they did, but instead of collapsing further, they found a bid. Yesterday, they chose to rally back to $4.22 (still well short of where they were last Friday). All I can and will continue to say is the important historical tendencies of early January trade to prices for the mid-term (see numerous posts from last week and the Weekly section currently). Is the low being established? no clue– but will respect the indications of trade behavior.
Major Support: $4.149, $3.638 Minor Support: Major Resistance$4.22-$4.39, $4.75-$4.825, $4.948, $5.056
Check the Weekly section but the declines have been extended from last week in the early trade last night. Results will be proven later but the market is hitting the extreme zones on the over – sold levels.
Major Support: $4.378, $4.34,-$4.149, $3.638 Minor Support: Major Resistance 4.75-$4.825, $4.948, $5.056
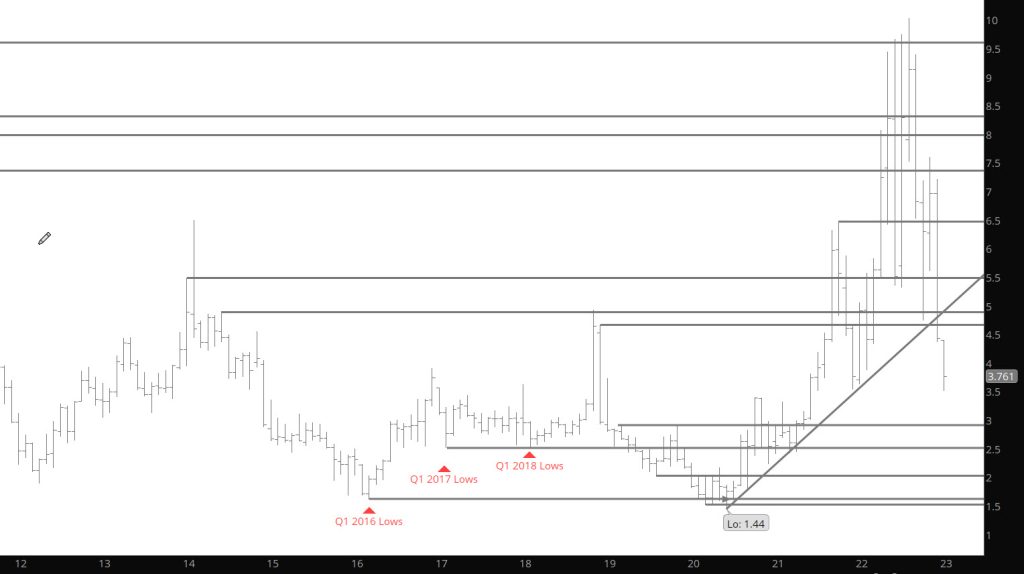
The warming weather trends last week took prices down to test levels of support that have not occurred since a year ago. As discussed last week the market has a tendency to develop a key level around the 1st of January.
…late December/early January highs or lows have consistently been disproportionately important going forward into each new year.
My good friend and phenomenal technical / history analyst provided me with the following (take from it what you will):
THE “JANUARY PHENOMENON”.
Almost since the beginning of recorded time (which in natural gas trading for convenience begins in December ’91 – January ’92 although trading at the NYMEX first began in April of ’90), late December/early January highs or lows have consistently been disproportionally important going forward into each new year.
To summarize…of those 31 years (since ’92):
Twenty – two have begun with a gap (although a couple of those times the gap occurred during the last or next to last trading day of the previous year).
In seven of the thirty – one years (five of which began with a gap) the high of the year traded during January, most often during the first week.
In seven of the thirty – one years (five of which began with a gap) the low of the year traded during January, most often during the first week.
In the other seventeen years, twelve of which began with a gap, either the high or low for January would not be violated for a period of months. If the gas market was rising the January low presented substantial support well into the New Year. If the gas market was falling the January high was substantial resistance. While nothing is always in the gas market, whichever is first violated (the January high or low) sets the direction of gas prices for an extended period.
Over the last five years the January low has been the low of the year twice…in ’21 and ’22. The January high was the high of 2019. In ’20 the January high was not exceeded until August, in ’18 not until November.
Expect a significant high or low to occur between January expiration and mid – January
Declines took prices down to and below the calendar Nov lows (clearly bearish) but did not close below and then recovered after the primary market close. Not sure if were going to test the October lows on this collapse but it is likely to occur (perhaps at the first of the year— see Weekly history comments). I apologize for missing the Daily yesterday — but that will not be the only occurrence for the rest of the month as I am traveling and celebrating the season. I will try to do my best but……..
Major Support: $5.61-$5.44, $4.716, $4.705-$4.68 Minor Support: $5.47, $5.337 Major Resistance$6.18-$6.29, $6.687, $7.038 $7.19-$7.221, $7.42, $7.532, $7.60-7.75, 8.021
Follow through buying took the prompt to $7.058 before a reversal lower. Another one on Tuesday in the opposite direction set the week’s high at $7.105 testing the resistance from the intersection of the 20 – week SMA and the still rising 40 – week SMA. From those levels, prices immediately retraced and closed the gap from Monday and closed the week in the middle of the range.
The results left prompt January $.355 higher, but examination of individual monthly gains in the winter prices, showed an interesting divergence. Weekly gains of February were over $.20 except for March. Sandwiched between February’s + $.221 and April’s +$.229 was March at +$.037. Chances are (guesses really) are that difference was a result of substantial buying of January and February while simultaneously selling March– sometimes referred to as a near – term bull spread. Building length in the remaining winter while offsetting that length in March. With strong volume in that spreading would indicate that folks are expecting additional winter strength in early 2023.