To read The Daily Call you must be a subscriber (Current members sign in here. ) Start your subscription today.
Daily Call
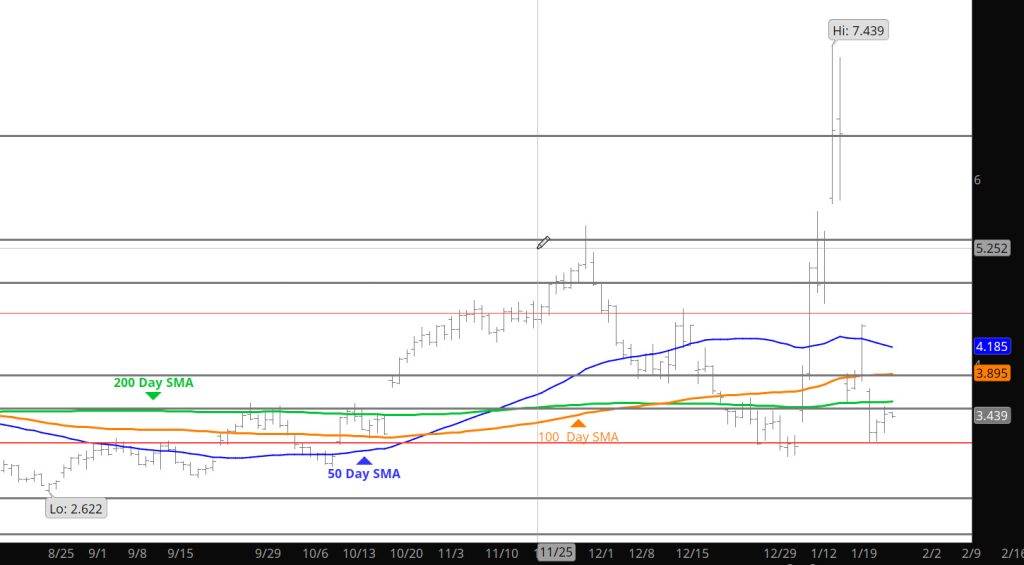
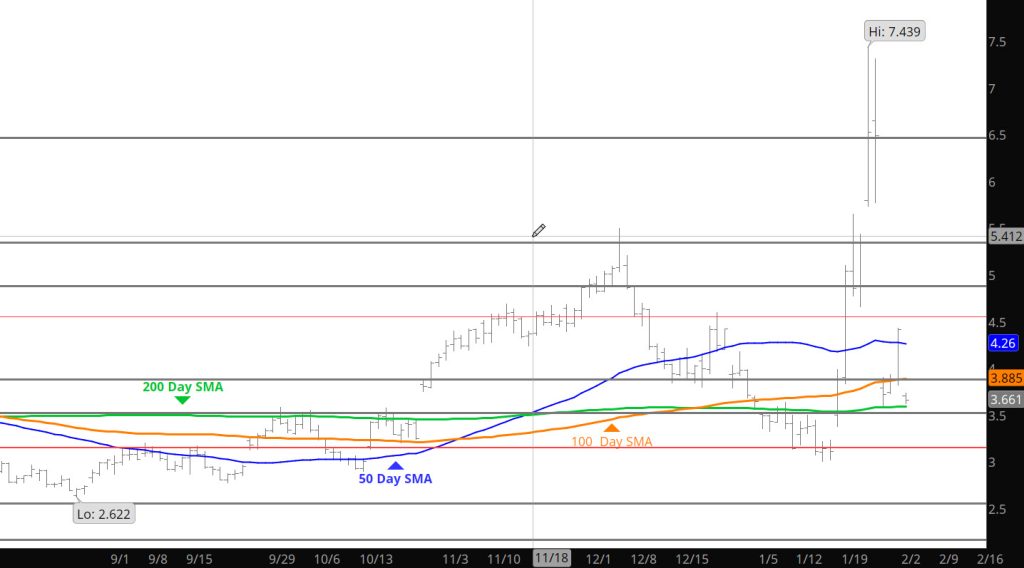
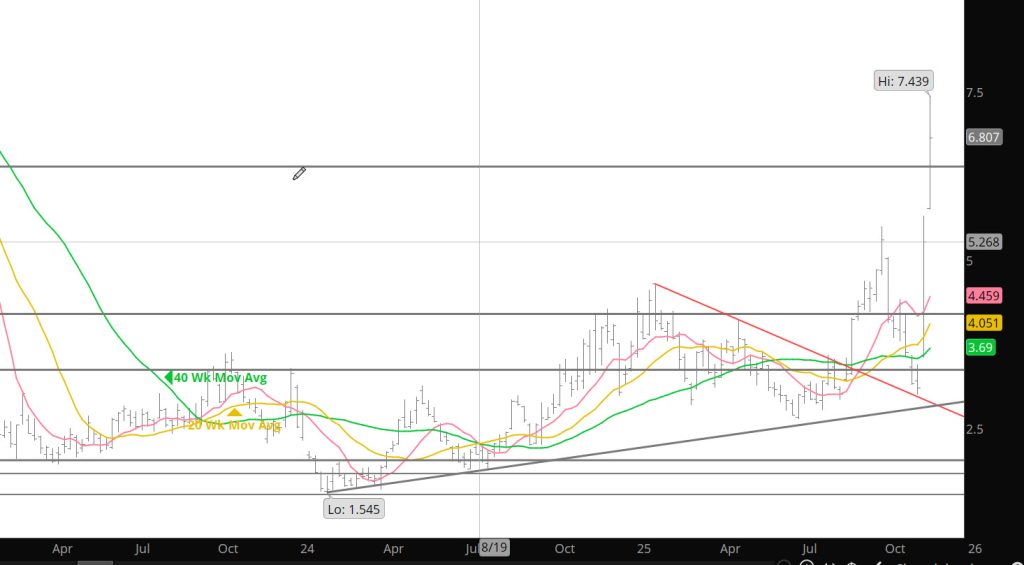
Range Trade Starts to Develop
Daily Continuous
Mentioned yesterday that a range would start to develop and was confirmed in the trade. Will likely take some sort of fundamental event to bring any volatility back to the gas market.
Major Support: $3.374, $3.16-$3.148, $3.136-$3.024, $2.93
Minor Support/Resistance :
Major Resistance: $3.787-$3.831, $4.063, $4.086, $4.593, $5.333, $5.496
No Longer Over-Bought
To read The Daily Call you must be a subscriber (Current members sign in here. ) Start your subscription today.
Large Discount for March Contract
To read The Daily Call you must be a subscriber (Current members sign in here. ) Start your subscription today.
Gap Up / Gap Down
To read The Daily Call you must be a subscriber (Current members sign in here. ) Start your subscription today.
Bullish Storage Release — Little Effect
To read The Daily Call you must be a subscriber (Current members sign in here. ) Start your subscription today.
March About to Take Prompt
To read The Daily Call you must be a subscriber (Current members sign in here. ) Start your subscription today.
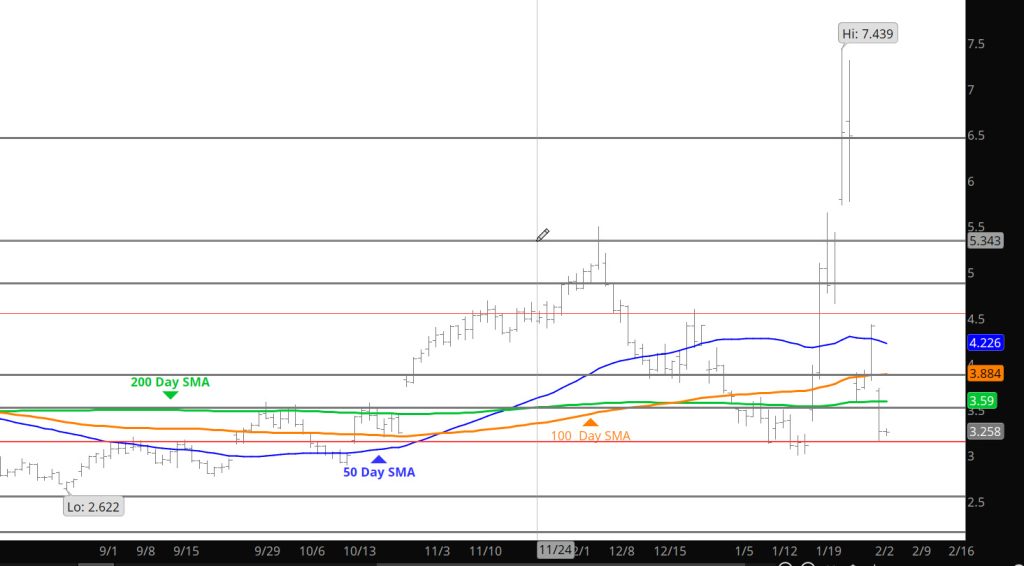
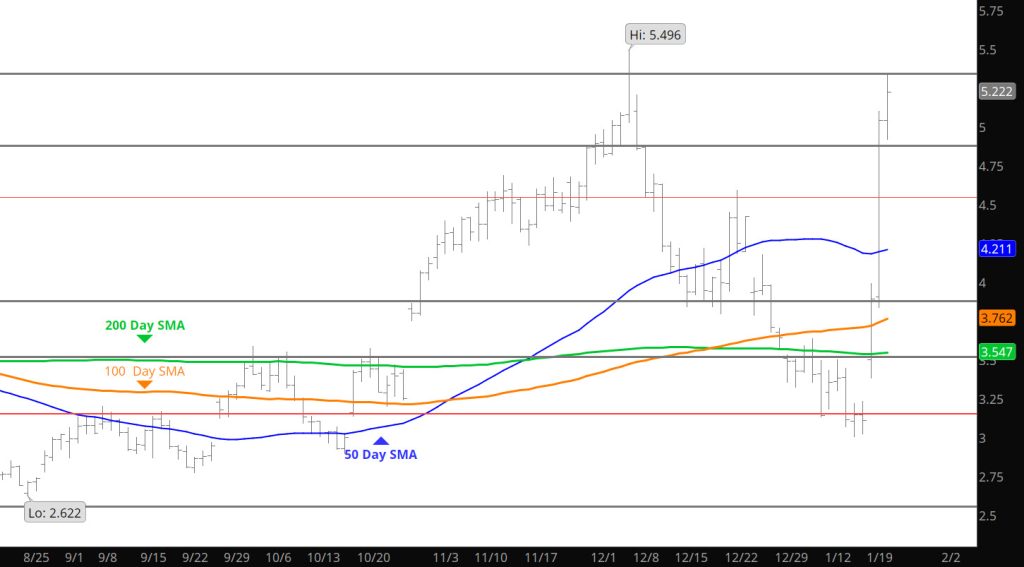
What Do You Know
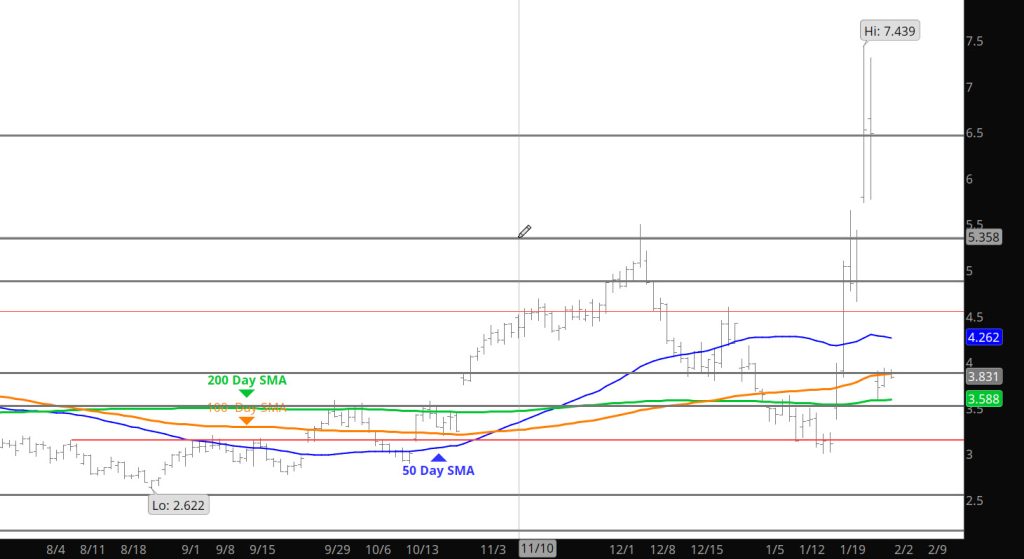
Daily Continuous
Wrote in the Weekly my hesitation to print a Daily yesterday and I suggest you read it. Some asked last week when this run would end and I mentioned that it depends on when the shorts are done covering and the forecasts moderate. Guess the shorts weren’t done until later in the day and the weather is still potentially have an impact on price. Not from the Feb standpoint — but the March price. Not sure where Feb is going to settle but odds are it will be at a significant premium to March and that will be where any forecast implication will be felt. Through all that volatility in Feb, March stayed “calm”
Major Support: $3.554, $3.374, $3.16-$3.148, $3.136-$3.024, $2.93
Minor Support/Resistance :
Major Resistance: $3.787-$3.831, $4.063, $4.086, $4.593, $5.333, $5.496
EXPIRATION WEEK
To read The Daily Call you must be a subscriber (Current members sign in here. ) Start your subscription today.
Weather Driven Short Squeeze Continues
To read The Daily Call you must be a subscriber (Current members sign in here. ) Start your subscription today.