To read The Daily Call you must be a subscriber (Current members sign in here. ) Start your subscription today.
Daily Call
New Prompt — Gap Enclosed
To read The Daily Call you must be a subscriber (Current members sign in here. ) Start your subscription today.
Prices Remain Quiet
To read The Daily Call you must be a subscriber (Current members sign in here. ) Start your subscription today.
Two Week Close at Same Level
To read The Daily Call you must be a subscriber (Current members sign in here. ) Start your subscription today.
Definition of Going Nowhere
To read The Daily Call you must be a subscriber (Current members sign in here. ) Start your subscription today.
Back to the Range
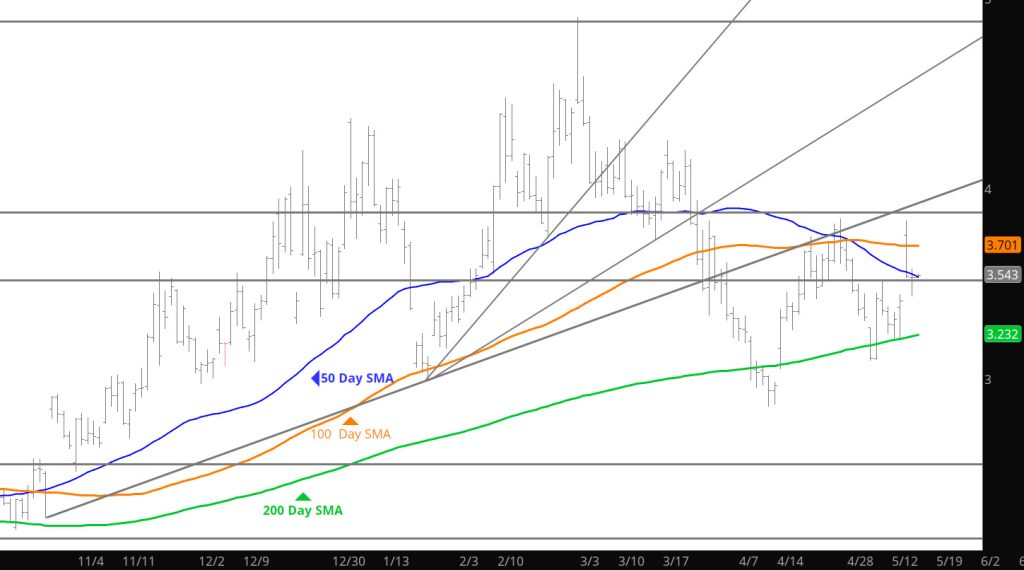
Daily Continuous
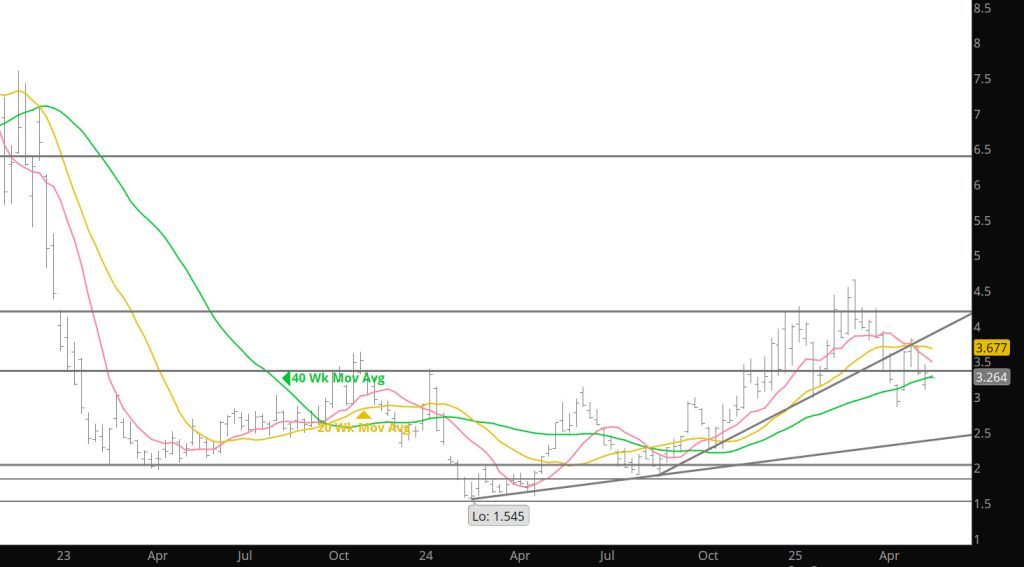
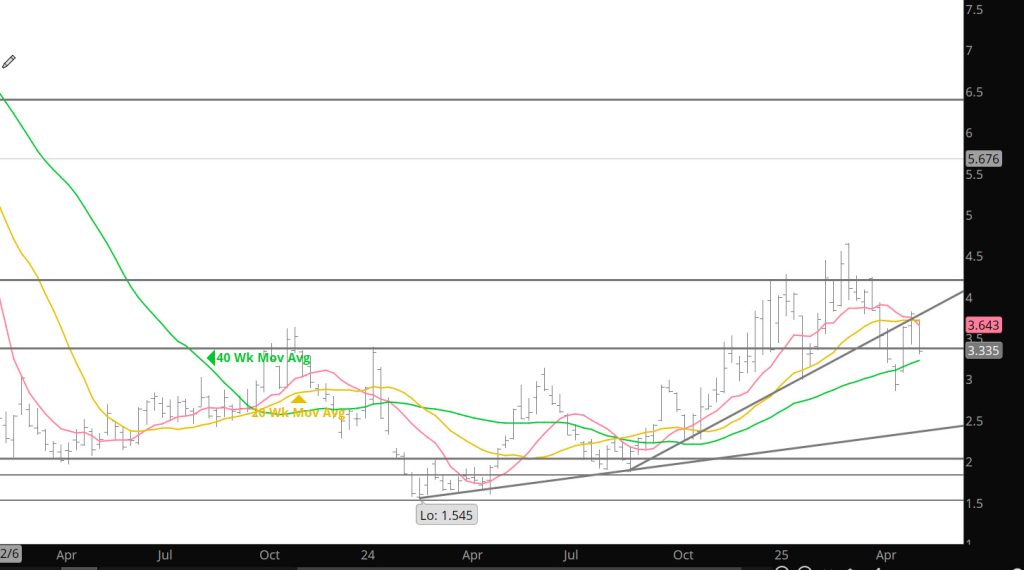
With the storage release I was wondering if the recent strength would be curtailed and that it was. The heading says it all – back into the range that June has created.
Major Support: $3.054-$3.007, $2.97, $2.727, $2.648,
Minor Support :
Major Resistance: $3.26-$3.305, $3.46, $3.628, $3.86, $4.168, $4.461, $4.501,
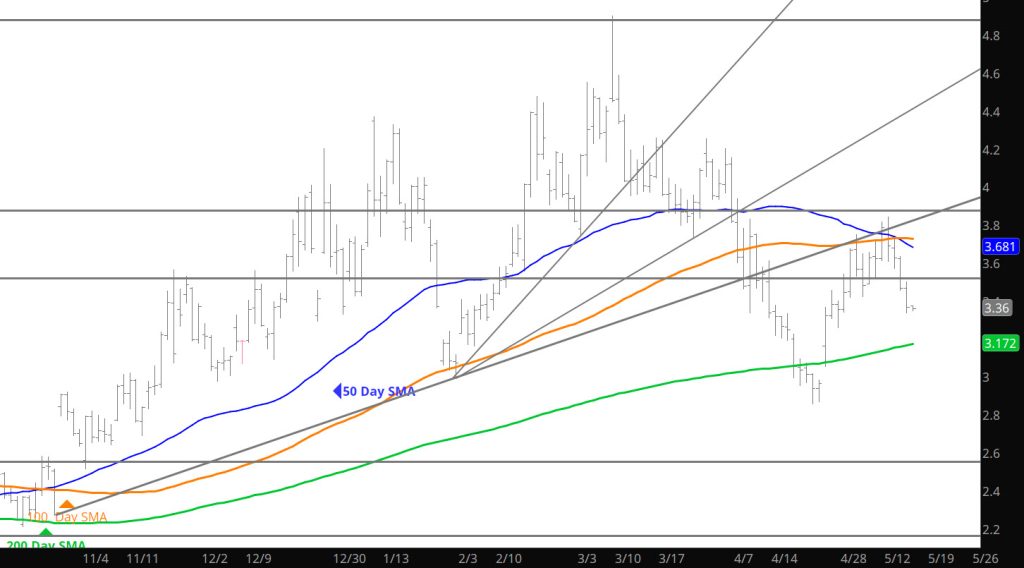
Solid Bounce

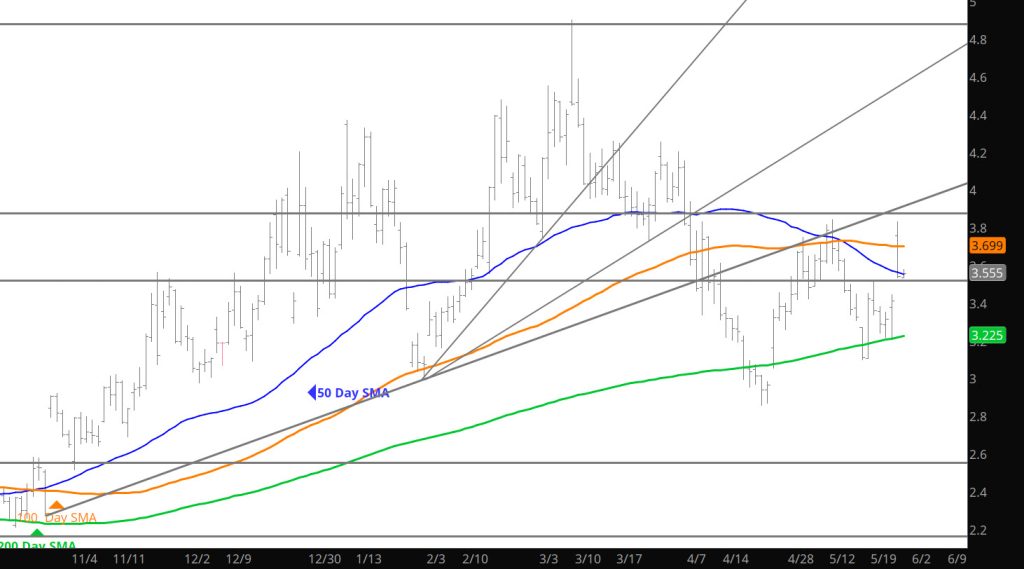
Daily Continuous
Prices refused to extend down to the April low of June gas and performed a solid rebound. Not sure this is a rally that should be jumped onto — there is a solid possibility that further gains will be hindered by the storage release coming up. Regardless, the market continues to trade with in the range that June has developed.
Major Support: $3.054-$3.007, $2.97, $2.727, $2.648,
Minor Support :
Major Resistance: $3.26-$3.305, $3.46, $3.628, $3.86, $4.168, $4.461, $4.501,
Prompt Approaching Lows
To read The Daily Call you must be a subscriber (Current members sign in here. ) Start your subscription today.
Expect Additional Weakness
To read The Daily Call you must be a subscriber (Current members sign in here. ) Start your subscription today.
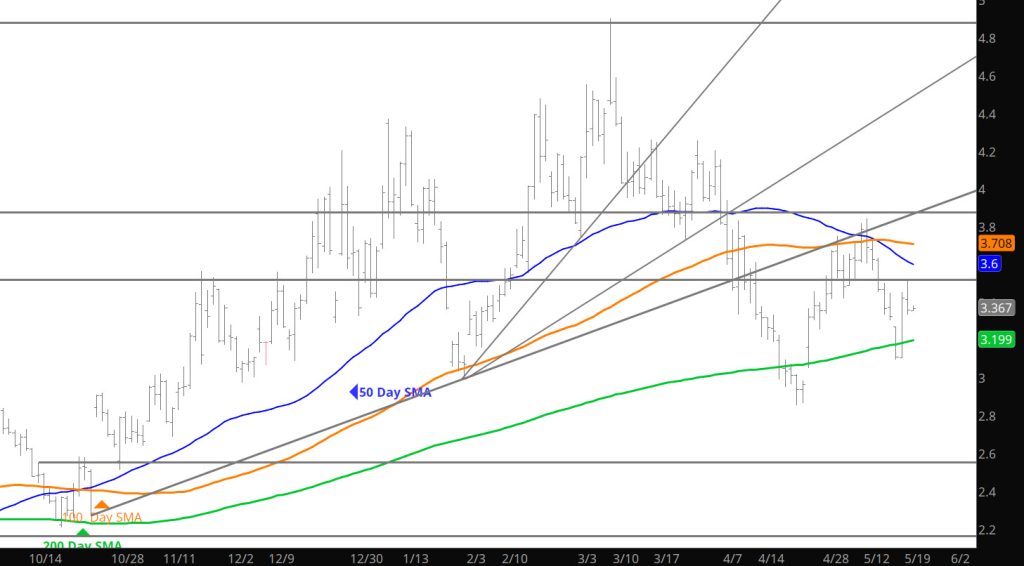
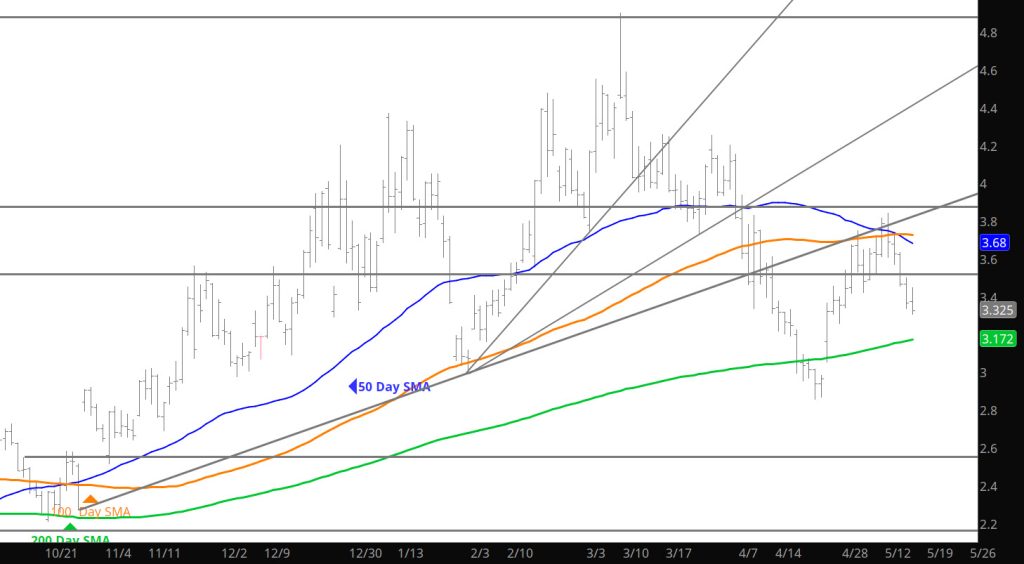
Storage Release Confirms Declines
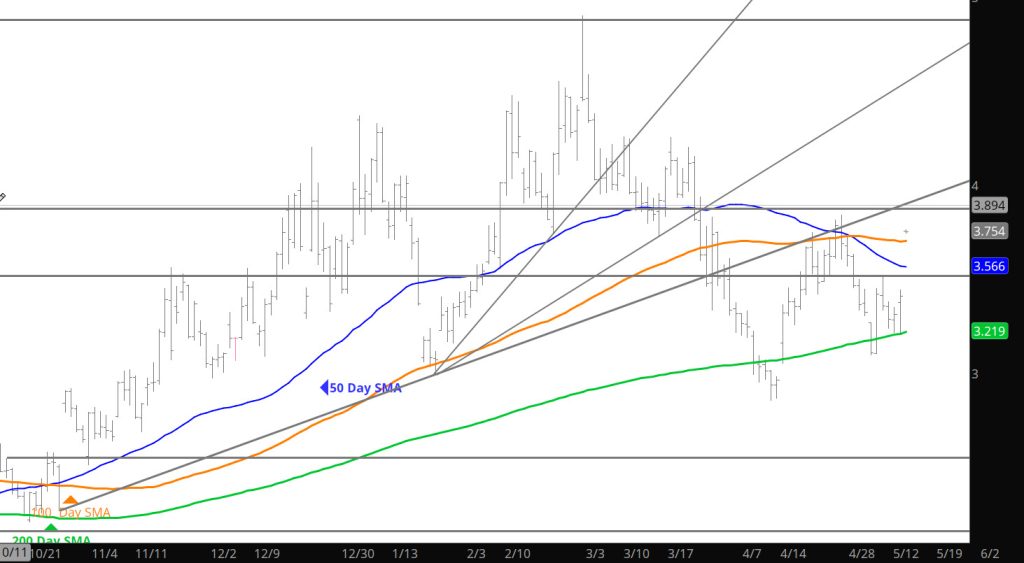
Daily Continuous
The slightly bearish storage data confirmed the near-term bias of declining prices. The Weekly close will be important for the near term price action but remember, we are still in a range for prices — just testing the low end of the range.
Major Support: $3.26, $2.97, $2.727, $2.648,
Minor Support :$3.423
Major Resistance: $3.628, $3.86, $4.168, $4.461, $4.501, $4.551, $4.746-$4.75, $5.03