The historical consistency of declines following rallies to calendar February highs were discussed over the last week particularly 2014 and 2021 (other years described briefly were ’03, ’05 and ’08) that I did not go into. While there were notable similarities between all but ’08, there were also some substantial differences in the degree of weakness that followed. The two most recent examples are illustrative.
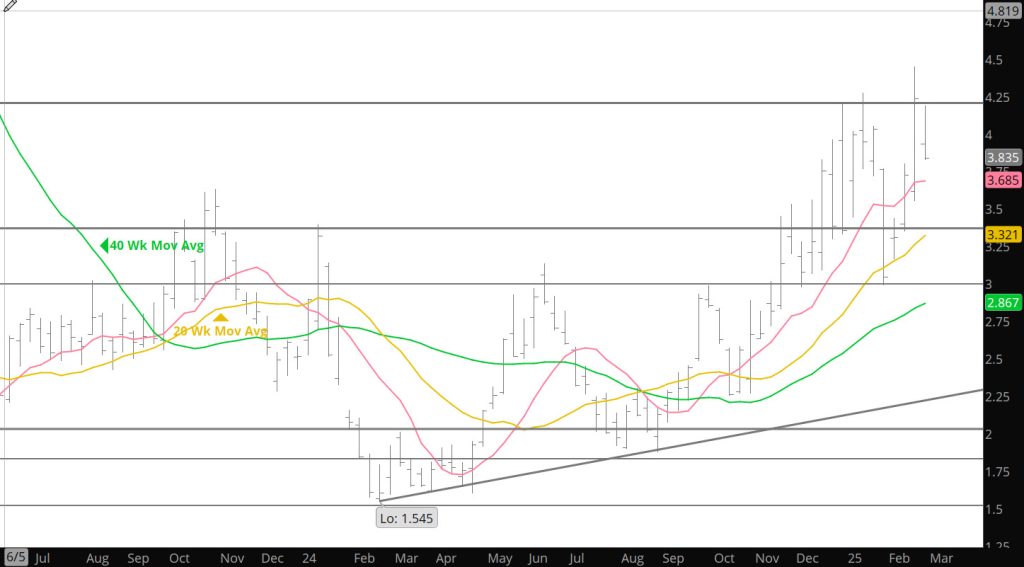
In 2014, March gas traded and reversed from its high on 02/24 (similar to March ’25), but the percentage decline to settlement was a little more than twice that of the recent decline. From the February high at $6.493 prompt gas fell to its “Q1” low on 04/02 at $4.221. An erratic Q2 rally peaked on 06/16 at $4.886, significantly below the average of Q2 rallies. Interrupted by several rallies which all peaked at lower highs prompt gas did not print the 2014 low until the last trading day of the year at $2.882.