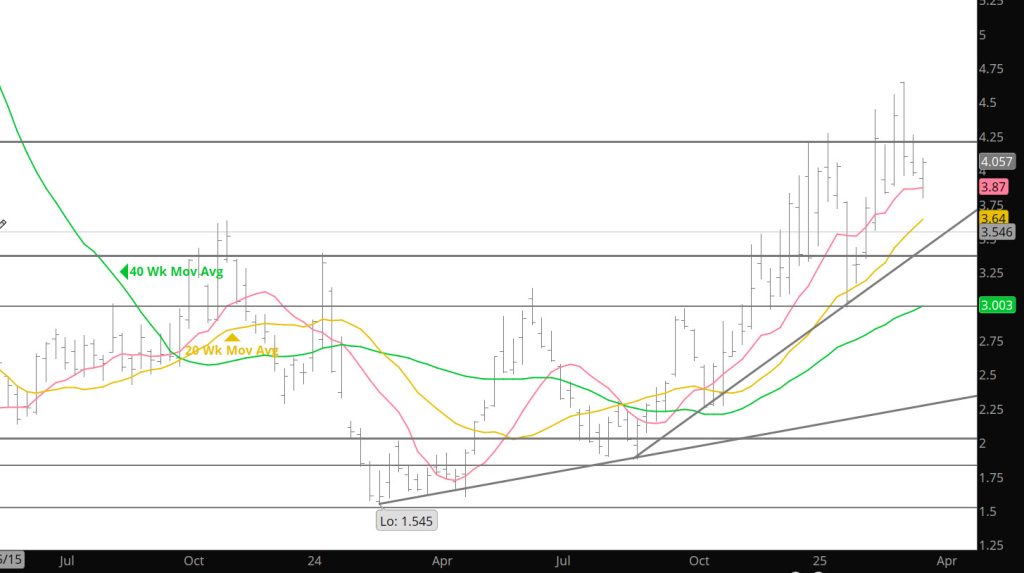
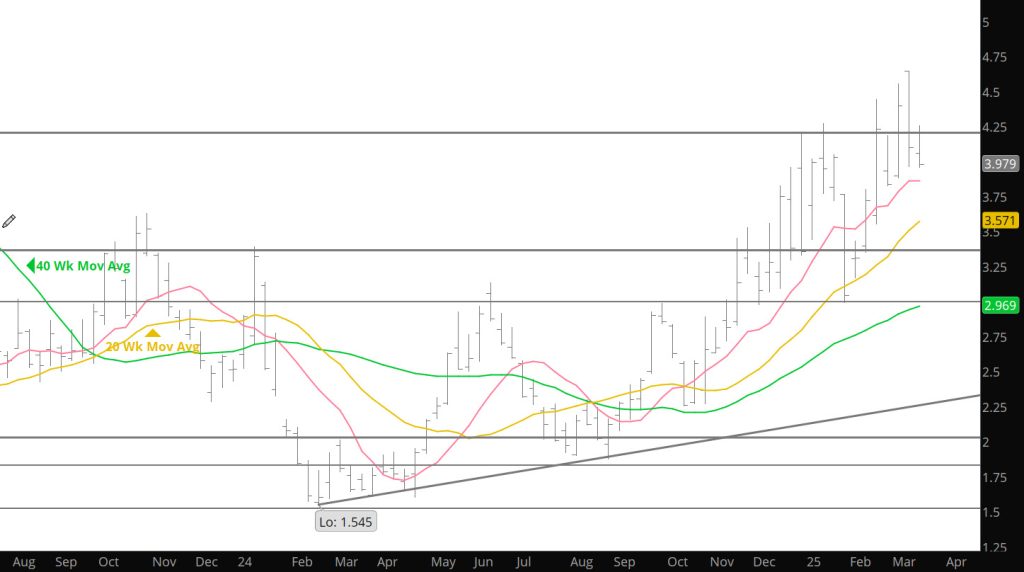
First Technical Indication Of a Slight Bias Change

Weekly Continuation

After trading through a previous week’s low in each of the last seven weeks followed by settling lower in seven of the last eight, prompt gas held above the expiration lows of August and then reversed to close higher, which was the first higher weekly close since the Friday before the June high.

While September traded a new contract low (trading through its previous week’s low for the eighth straight week while falling from $3.193 to $1.882, trading as contract prompt it held above the 07/29 low. A reversal higher followed that extended through last week’s high (both on a continuation and contract basis) and did so with a significant increase in volume. September traded an “outside” week reversal. While it did not close above $2.149 (last week’s high) it was close at $2.143.

To read The Daily Call you must be a subscriber (Current members sign in here. ) Start your subscription today.

Weakness Prevails

Weekly Continuous

August gas fell into expiration as was expected. This makes it the seventh straight month (all of the expiration’s in calendar ’24) the prompt was amply offered into expiration and the fourth of those seven to trade the low of its tenure as prompt coincident with expiration.

New prompt September closed higher for two days after August was off the board, managing to close above some declining trend line resistance, but without volume confirming the recovery with a reversal following with increased volume (and a significant increase in open interest strongly suggesting heightened interest in shorting the new prompt). September traded new contract lows on Thursday and Friday, trading as low as low as $1.920 before ending the week $.084 lower (on a continuation basis prompt gas was .0$39 lower). August’s closing range before recovering raises the technical odds that September will get a shot to finish closing the gap. If September closes below $1.848 then the daily gap comes into focus ($1.628 – $1.85).

On May 1st total open interest was 1,587,270. By June 12th the total had fallen to 1,443,769 allowing for that nearly 150,000 contracts of short covering had been a significant contributor to the June 100%+ rally. Since 06/12 open interest has returned to and this week surpassed the early May high (currently 1,592,601). That total is less than 25,000 contracts below the twin peaks that preceded the February and March lows.

Give the downside momentum created by the multiple weeks decline from the June high, the expected weak expiration of August gas and September trading a new contract low, expect the prompt to be offered lower to close the late April gap. On a weekly continuation basis, the fraction of that gap remaining is between $1.848 and $1.856.

Longer term, these declines and the constant attack at rallies by the bears will lead to a short covering rally similar to what was experienced in early June. Perhaps, that will be the driver for the annual upcoming Q4 run.

Major Support:, $1.848, $1.52-$1.511, $1.481, $1.312
Minor Support : $2.00, $1.967- $1.94
Major Resistance: $2.39, $2.44-$$2.502, $2.618, $3.00, $3.16

Is It the Q3 Low

Weekly Continuation

Failure at the conventional and trend line resistance on Monday and again early Tuesday (20 Week SMA) put August on the same track as its predecessor contract months which (as discussed in the Daily) a low volume decline into expiration. With one day left for prompt August before it goes to settlement, technically it does not matter what happens tomorrow unless there is some kind of high volume price surge (regardless of early Sunday night trade). Given that Friday’s close was the lowest daily close since May 1st and the lowest weekly close since prompt May settled at $1.619 on Friday April 26th, the chances of another “amply offered” expiration seem greater.

The bottom line is that prompt gas held a zone of support defined by the March high ($2.009), the mid – April high ($1.943, the high of week ending 04/12) and $1.913, the low of calendar May, as trading for the last week of August’s tenure ended, tenuously. For the first time since just after the “expiration” gap following May going off the board, prompt gas traded sub – $2…to $1.994, and September ain’t far behind ($.045 premium to August).

To read The Daily Call you must be a subscriber (Current members sign in here. ) Start your subscription today.

Decision Coming To Gas

Weekly Continuous

Some expectations that proved correct was that if August traded through its February low ($2.207) the next support level would be the zone between the March and April highs ($2.009 – $2.092, the January low, $2.037, is also within that zone). It did not take long. Each day’s decline was supported by increasing volume and open interest as August began the test of the same zone that was repeatedly tested during the early spring of ’23 (and had failed to hold during a similar time frame earlier this year). Before a modest recovery, the highest volume since the June high accompanied the lowest trade since May 3rd, and the lowest close since May 2nd.

Clearly, the gas market is in the grips of its traditional Q3 decline (which has carried further faster than suggested here). From the June high prompts July then August have fallen as much as $1.144 from the June 11th Q2 ’24 high (36.2%). Friday’s close was almost exactly 61.8% (Fibonacci) retracement of the rally from the March low to the June high and a prompt contract was back below the 20 – week SMA for the first time since May expiration. From the “expiration” gap that followed May expiration…when the rally really began, to the June high took seven weeks. Over the last six weeks prompt gas has erased all but about a dime of that rally, and the gap is still open between $1.848 – $1.913.

To read The Daily Call you must be a subscriber (Current members sign in here. ) Start your subscription today.

Stumped

Weekly Continuous

August finished Monday higher for the first daily gain of its tenure as prompt (actually for the first time since a daily reversal higher on 06/24). Some of that support interest in August was a product of late coming shorts covering, but a 13,600 contracts increase in open interest suggests that there was also some new buying. The reversal from a lower low was enough to inspire an extension of the bounce to test first resistance. The value of the declining 40 – week SMA was $2.442, the high for the week was 2.448. Failure at the moving average resistance was followed by three more lower daily closes (making it eleven of twelve for August gas since June 24th (which rivals the nine of ten lower closes that led to the February low). The lowest of the daily closes was $2.269 which was the lowest for a prompt contract since 05/10. Violation of that zone of support would put a big target on conventional support presented by the highs of calendar March and April (2.009 – 2.092, see Chart I) and then the “expiration” gap left after May gas went off the board ($1.848 – $1.913,). My guess is those targets will remain untested until later in this quarter but not right now. It may prove noteworthy that September traded a lower low while it was losing the little bit of premium that had been awarded over August.

With prompt gas having tested and retested the support within that range an intermediate term uptrend began during Q2. That uptrend extended into the band of resistance, but the divergences that have occurred indicates that the sponsorship to break from the long term trading range was absent and an intermediate term down trend (the declines from the Q2 high toward a Q3 low) has begun.

To read The Daily Call you must be a subscriber (Current members sign in here. ) Start your subscription today.

That Is a Bearish July 4th Trade

Weekly Continuous

The case was made that conventional and moving average support would provide a floor for the historically consistent price decline bracketing Independence Day — to say the least –it didn’t. Since a day before July went off the board (06/25) amply offered August gas has closed lower for eight straight days. Add to that, the prompt plus the last two of July’s, and at Friday’s low retraced 50% of the rally from the March Q1 low to the June Q2 high.

The historical averages for the seasonal decline (per the chart provided previously) were: 20 years, 16.4%, 10 years, 13.5%, 5 years 13.7%. The following is an update summarizing the recent declines and the results:

To read The Daily Call you must be a subscriber (Current members sign in here. ) Start your subscription today.

August As Prompt Within the Continuous Range

August Spot Contract

Prompt August, which had already closed below a short/intermediate – term trend line got off to an inauspicious beginning. On its first day August closed below its 50 – day SMA that it had closed above each day since May 3rd. On its second day the new prompt traded through its to date June low ($2.656 on 06/04) and then its post – Memorial Day low ($2.605 on 05/31)…and settled for the week below both of those of those lows. It is hard to put a bullish spin on that but there are a few mitigating factors. One element that should be made clear is that the behavior last week (and month) did provide an interesting range for the upcoming August contract as shown above. Similar to the July contract, there is a nice double top and now a solid test of the support zone is developing. Expect this range, which falls nicely into the range the market has maintained this spring (Continuous basis).

Weekly Continuous

The expectation was that the expiration process would continue the trend of being well offered and test the major support zone ($2.60-$2.50). It did not quite make it (the expiration day low was $2.613), before settling not so much higher at $2.628 ( a $.135/dt than June). From a technical perspective- prompt gas did test the wider zone of support between +/-$2.450 and $2.640, which included 50% and 61.8% retracement of the rally from its February low and August continued to test that zone after July was off the board.

To read The Daily Call you must be a subscriber (Current members sign in here. ) Start your subscription today.

Monthly Trend Expiration Remains

Weekly Continuous

Been discussing the trend of the contract months that have expired during 2024 have been amply offered during their closing days (March, April and May traded the lows of their tenure on the day they went to settlement). February didn’t but lost $.443 (from high to low) over its last three days. June lost $.507 over its last four days as it fell from $2.924 to test the continuation 200 – day SMA. July would appear to be on a similar path. Expect expiring July to test the zone of support between +/- $2.450 and $2.640, which includes 50% and 61.8% retracement of the rally from its February low, its 50 – day SMA and the nearly flat continuation 200 – day SMA that held near the low of expiring June. A failure by July to weaken into expiration would indicate a change in the character and or bias of supply and demand for gas.

Changes in market internals, specifically volume and open interest, strongly suggested approaching the gas market with extreme caution from the long perspective. Prompt gas had traded higher highs with diminishing volume. The May high ($2.924) had traded with a weekly turnover of 3,378,217 contracts, the June high ($3.159) with 3,047,011contracts. At the same time July traded a textbook double top when it challenged its May high. On May 23rd 258,561 contracts traded, 200,816 when it reversed lower from the June high but lacked the buyers to push it further.

To read The Daily Call you must be a subscriber (Current members sign in here. ) Start your subscription today.

Q2 Run May Have Materialized

Weekly Continuous

The seven week rally that began following May expiration, has left the gas market severely overbought and delivering multiple clues that suggest the spring rally has run its course. The decline in open interest is one of those clues. Higher price highs without increasing open interest indicating new buying support entering the market, is a form of divergence.

Higher price highs accompanied by lower volume is another (occurring the last couple of weeks) is one that has proved exceptionally reliable over the years. During week ending 05/24 3,387,217 contracts changed hands, this past week a higher high traded with 3,075,538. The high of $3.159 may not be the Q2 high but there is a growing body of technical evidence that will be hard for the market to overcome including in addition to the foregoing:

To read The Daily Call you must be a subscriber (Current members sign in here. ) Start your subscription today.

A Weekly Reversal of a Reversal

Weekly Continuation

Spoke a couple of weeks ago about Natural Gas’ tendency to define a bias shift as the price changes direction at a support or resistance area and reverse direction on a high volume week. Now we get a reversal higher last week, from and area that had supported the market previously (just below $2.50) and then found support. The lows of last week were just above the 40week SMA, before finding the bid and running upward to end the week over the downward sloping trend line (from the Nov ’23 high and Jan ’24 highs) that had held the market for the first 6 months of the year.

Volume during the last week was high, averaging 574,278 contracts per day. This was significantly higher than the previous week, but well short of the previous reversal week which averaged over 663,000 contracts per day. Similar to the previous reversal week- open interest declined slightly last week. The reversal last week left prices in the extreme over-bought zone for the Weekly RSI but not the Daily RSI, signalling a slight divergence.

To read The Daily Call you must be a subscriber (Current members sign in here. ) Start your subscription today.