To read The Daily Call you must be a subscriber (Current members sign in here. ) Start your subscription today.
Category: Weekly Detail
Still Negative After All These Months
To read The Daily Call you must be a subscriber (Current members sign in here. ) Start your subscription today.
Lower Boundary Tested
To read The Daily Call you must be a subscriber (Current members sign in here. ) Start your subscription today.
Negative Bias Reinforced
To read The Daily Call you must be a subscriber (Current members sign in here. ) Start your subscription today.
Similar to Recent Months Trade Begins Defining Range
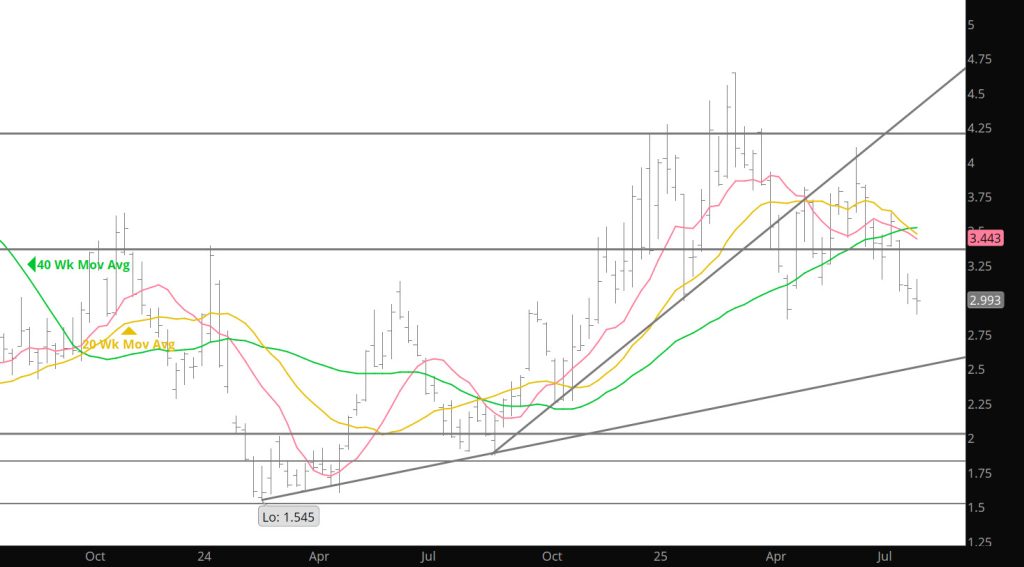
Weekly Continuous
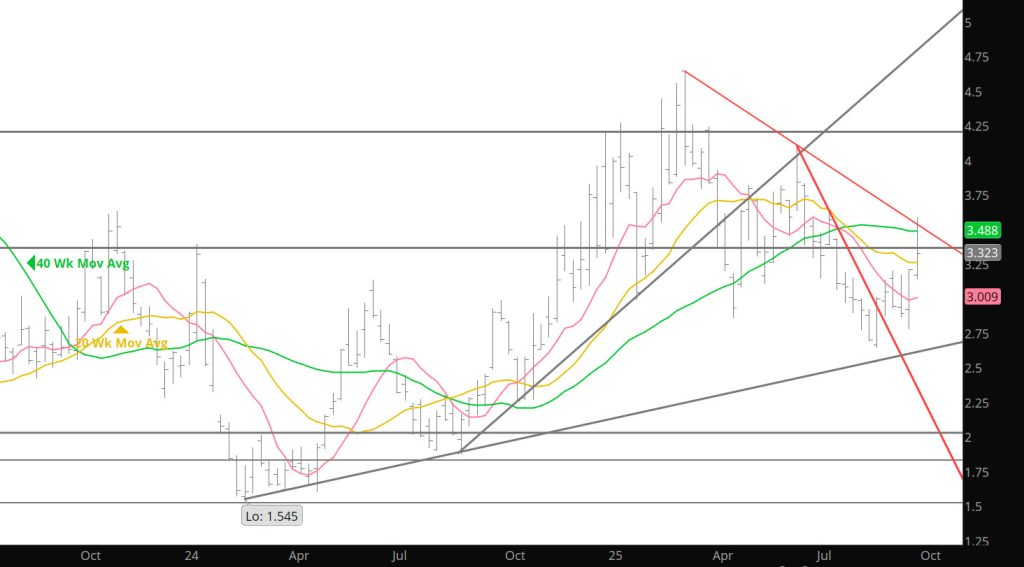
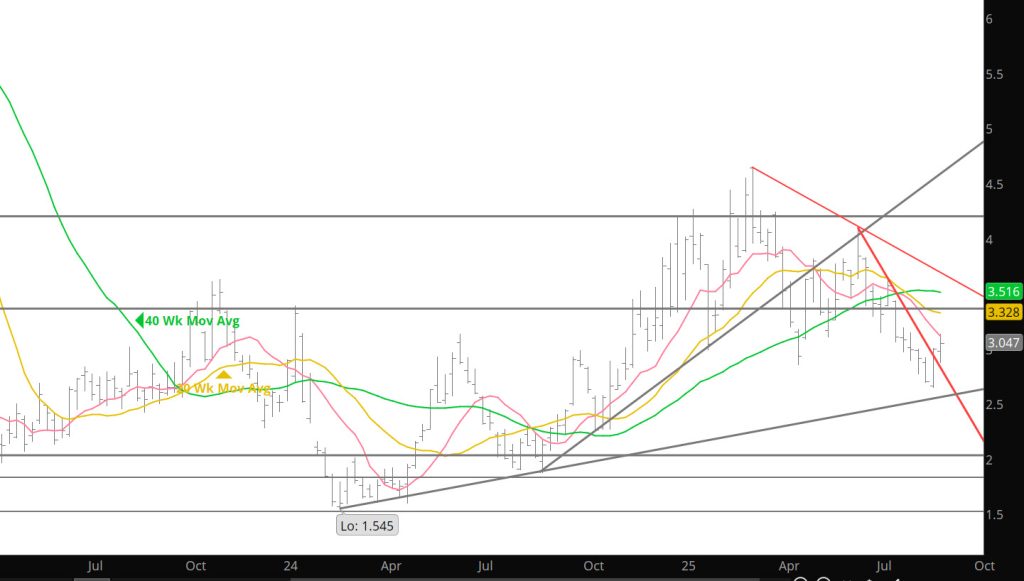
Although working against the current of seasonal price negative bias, until fading on Friday October gas had closed higher for eight straight days (it has been a while since any contract did that). For the holiday shortened trading week the prompt was the only contract to gain, + $.051, but November’s loss was negligible, $.005. The other ten months of the one year strip lost $.035 to $.071.
The price level attracting sellers was obvious…the declining 50 – day SMA. The highs of three of this week’s four trading days were within a penny of the gradually falling moving average. Interestingly enough, the continuation 50 – day SMA was an influence then as it was during the past week, once breached it became support for a rally that extended through October ‘24’s last trading day. Last year, following October ‘24s rally into expiration new prompt November gas up the gains and returned to test the 50 – day before December kicked off the real Q4/Q1 rally that finally peaked on March 10th.
The consensus of technical indications, which began to improve last week, improved enough to be rate neutral – negative after remaining negative for nine weeks. A week ago neither volume nor open interest confirmed lower lows…this week average daily volume and open interest increased along with October. Prompt gas reversed from more than two standard deviations below the 20 – week. This week’s higher trade tends to confirm that reversal. The daily ATR increased a little…from $.126 to .$131. The weekly ATR fell to $.380. The moderation of volatility may become a significant technical factor.
Major Support: $3.00-$2.97, $2.843, $2.727, $2.648
Minor Support :
Major Resistance: $3.061, $3.16, $3.192, $3.25-$3.31,$3.39, $3.62, $4.168, $4.461,
Can October Keep Its MoJo
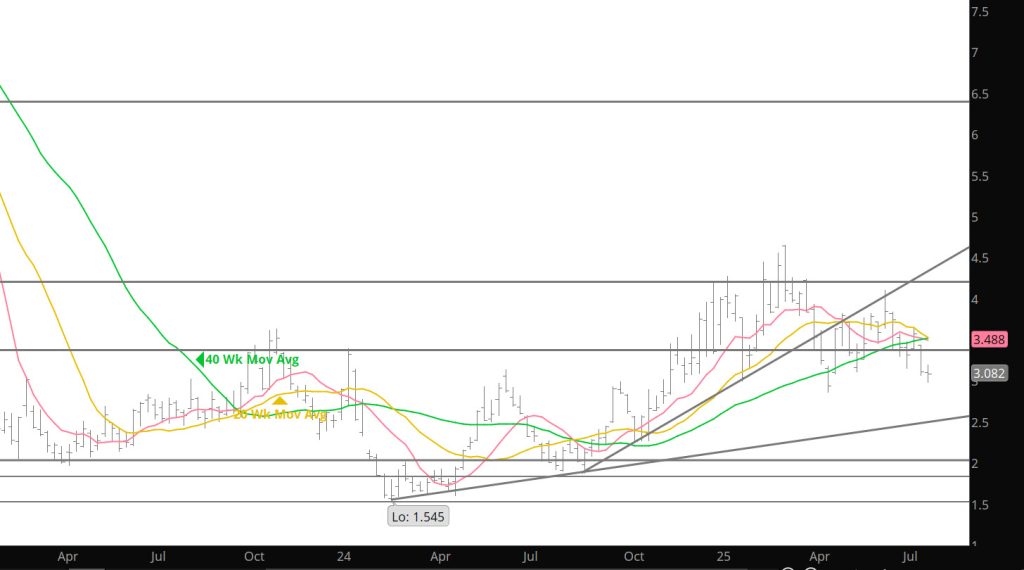
Weekly Continuous
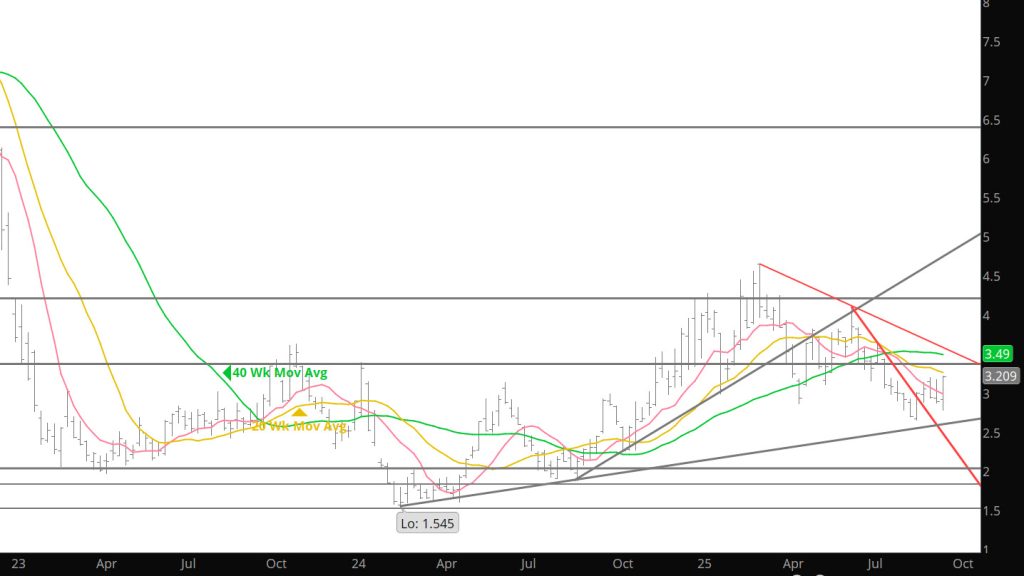
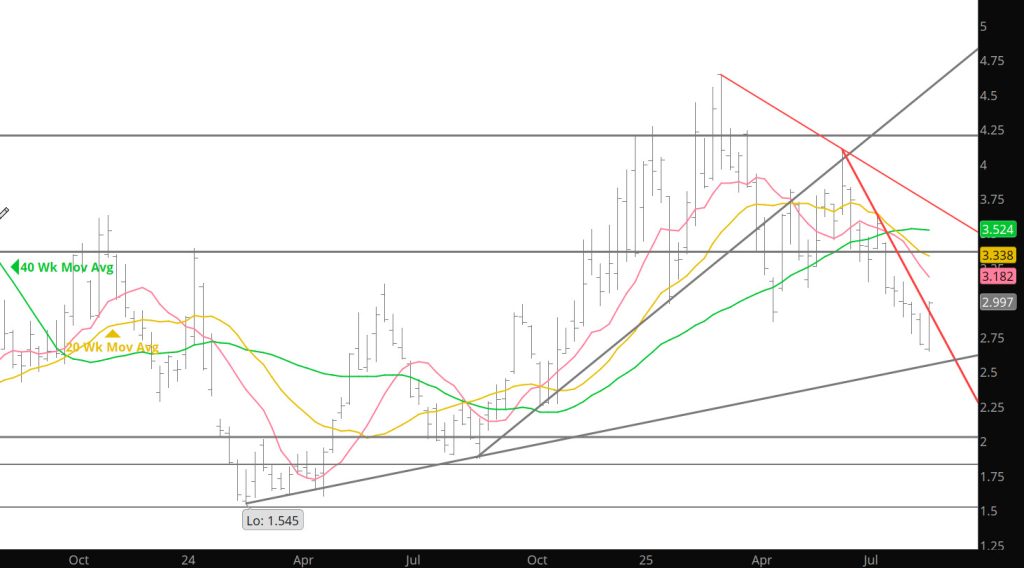
Prompt gas traded a semi – classic “outside” week reversal from a new low for 2025, ”semi”, because the reversal came with lower volume than a week ago.
A classic weekly reversal (market’s preferred method of signaling that an unsustainable low (or high) has traded, trades with volume greater than any recent week. The absence of higher volume during the past week suggests that while a significant low is likely in place it is also likely some testing will be required to confirm that low. The reversal was particularly noteworthy because it came without a significant contribution from premium awarded to the new prompt. When September went off October was awarded only $.019, suggesting little sentiment for any kind of rally. A year ago October was awarded $.117 premium and ultimately rallied through Labor Day and to trade the high of its tenure as prompt the day it went off the board. This week’s low traded almost exactly on the anniversary of the Q3 ’24 low (08/25 v 08/28).
The new prompt closed back above the weekly trend line violated a week ago, and above the value for calendar August for the monthly trend line ($2.997 v $2.978). Notwithstanding that lack of confirmation, last week’s violation still suggests that the uptrend is vulnerable.
Basic technical analysis suggests that once a well – defined trend line is violated the price objective becomes the next readily identifiable trend line. In this case that is the trend line declining from the March and June highs . On a continuation basis the current value of the declining resistance is $3.553, falling about $.055/ week. On the October chart the value is $3.495 falling about .07/week.
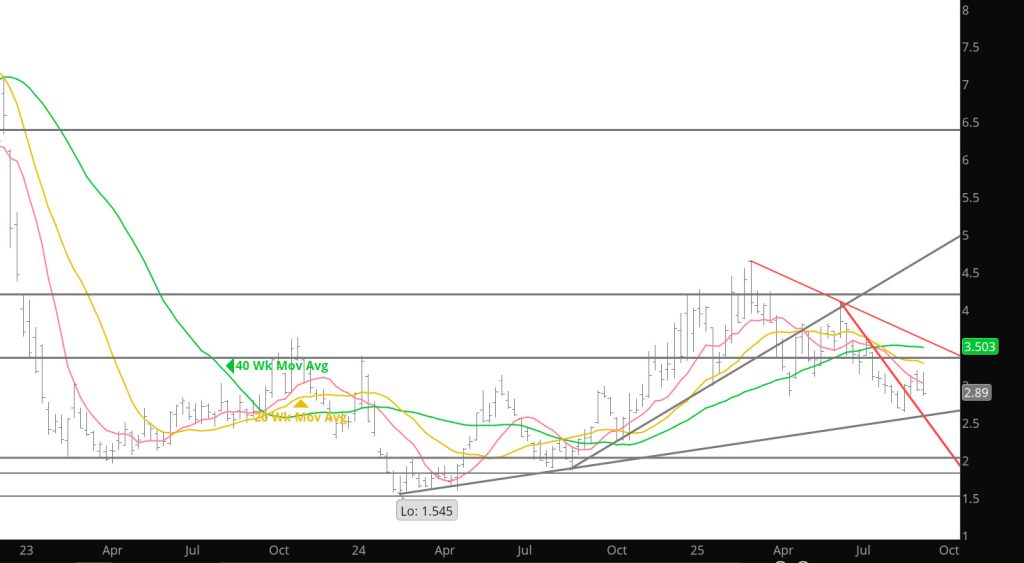
October rallied from $2.735 to $3.029, closing higher each day of the past week. It has been a while since gas closed higher for five days (prompt gas for four). It is likely that the rally days resulted from an oversold condition and minor short covering. Open interest did fall modestly this week (price up, open interest down means short covering was a contributor) but it was also an expiration week (when the last holdouts in an expiring contract balance their books).
The test is going to be whether buyers continue to bid up October when trading resumes. Resistance is plentiful, beginning not far above Friday’s close and then there is the early September price negative seasonality discussed previously. If, October can extend its rally despite that negativity then it will begin to look like October ‘24s tenure.
A year ago after the August low October suffered only a minor setback after Labor Day then continued to rally setting the high of its tenure on the day it went to settlement. Prompt November did give up most of the gains but traded a higher low and then Q4/Q1 rally, lasting until March, began.
Neither volume nor open interest confirmed lower lows with the Bollinger Bands study showing prices more than two standard deviations below the 20 – week SMA. Momentum indicators began to moderate with the primary “leading” indicator turning up without reaching extremely oversold conditions, but it seems the most significant technical factor is the absence of volatility. The average range of the last fifteen days has fallen as low as .121 (08/26). A year ago one day ahead of the August Q3 low the daily ATR was .112.
Major Support: $2.843, $2.727, $2.648
Minor Support :
Major Resistance:$2.97-$2.99-$3.00, $3.061, $3.16, $3.192, $3.25-$3.31,$3.39, $3.62, $4.168, $4.461,
Expect Further Declines
To read The Daily Call you must be a subscriber (Current members sign in here. ) Start your subscription today.
Not Sure if Q3 Low Is In
To read The Daily Call you must be a subscriber (Current members sign in here. ) Start your subscription today.
Likely To Be Important Week for Bias
To read The Daily Call you must be a subscriber (Current members sign in here. ) Start your subscription today.
A Market Needing Stimulus
To read The Daily Call you must be a subscriber (Current members sign in here. ) Start your subscription today.