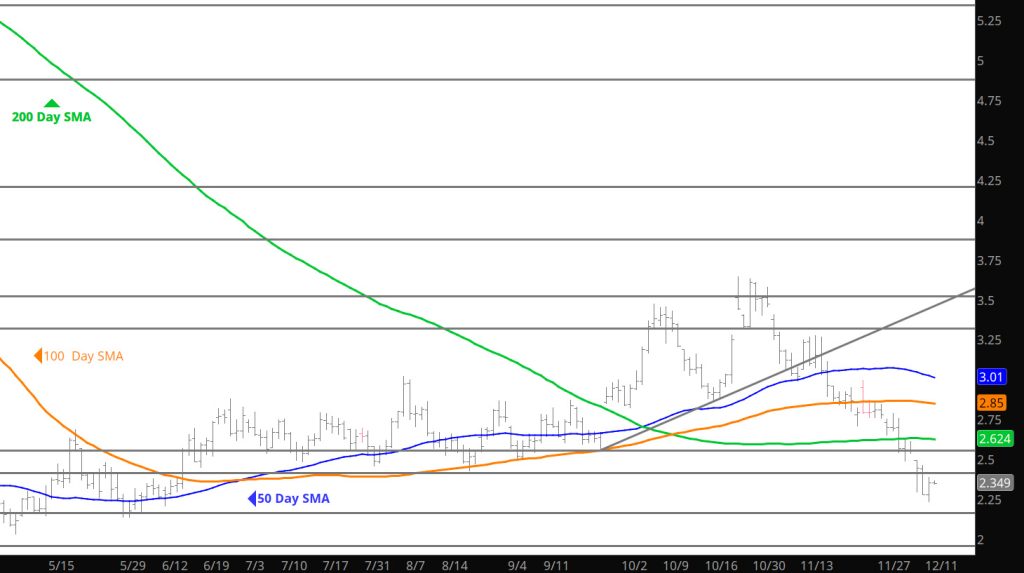
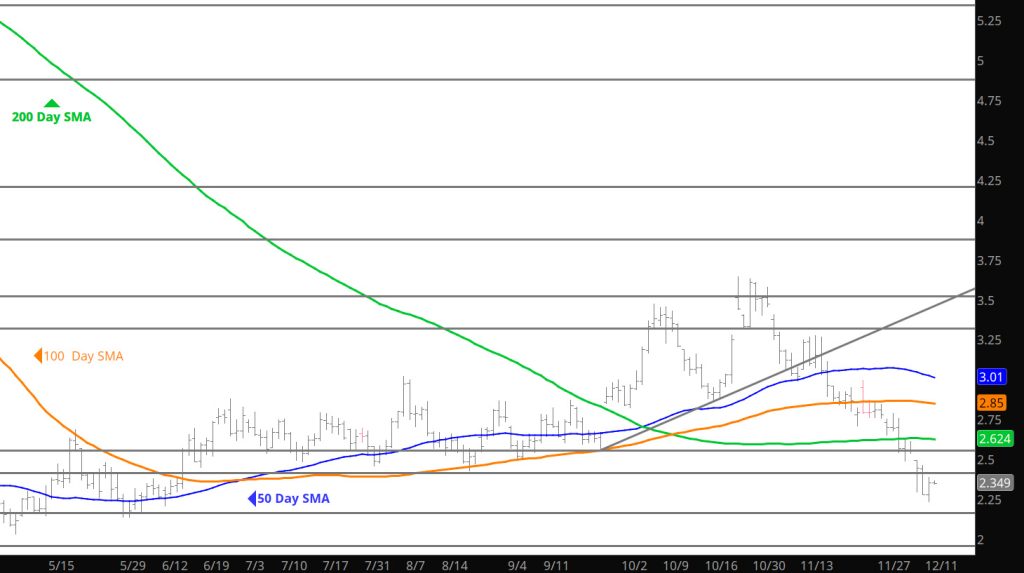
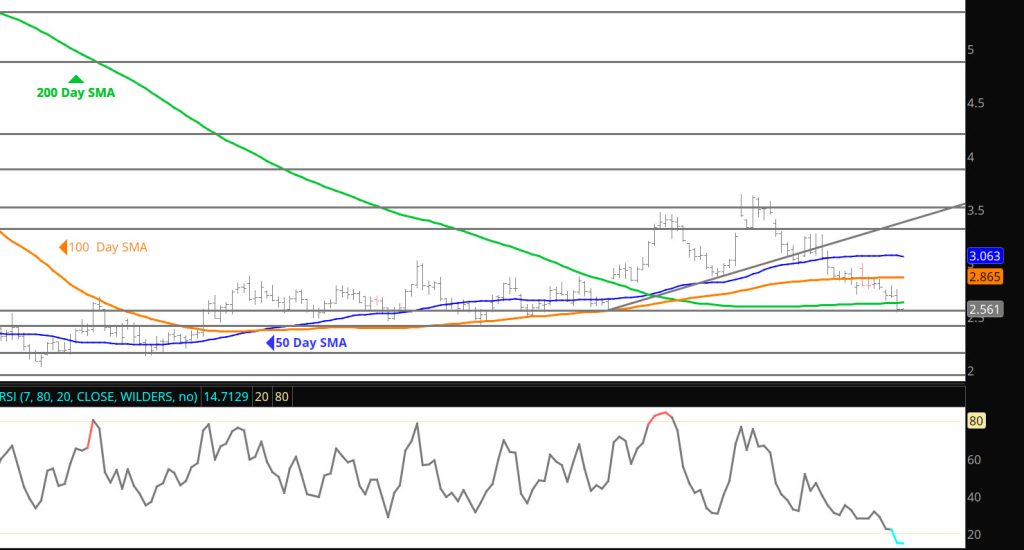
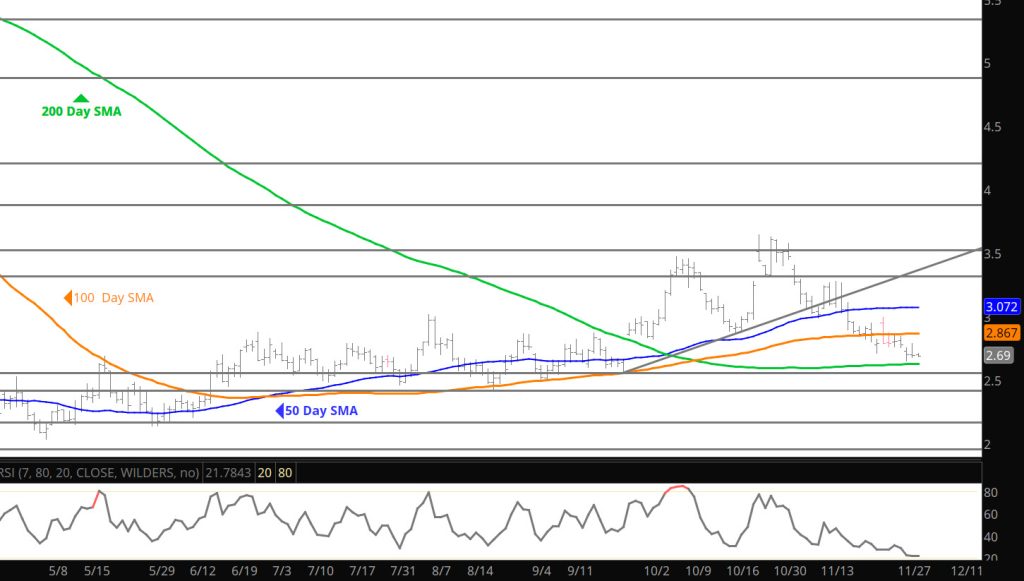
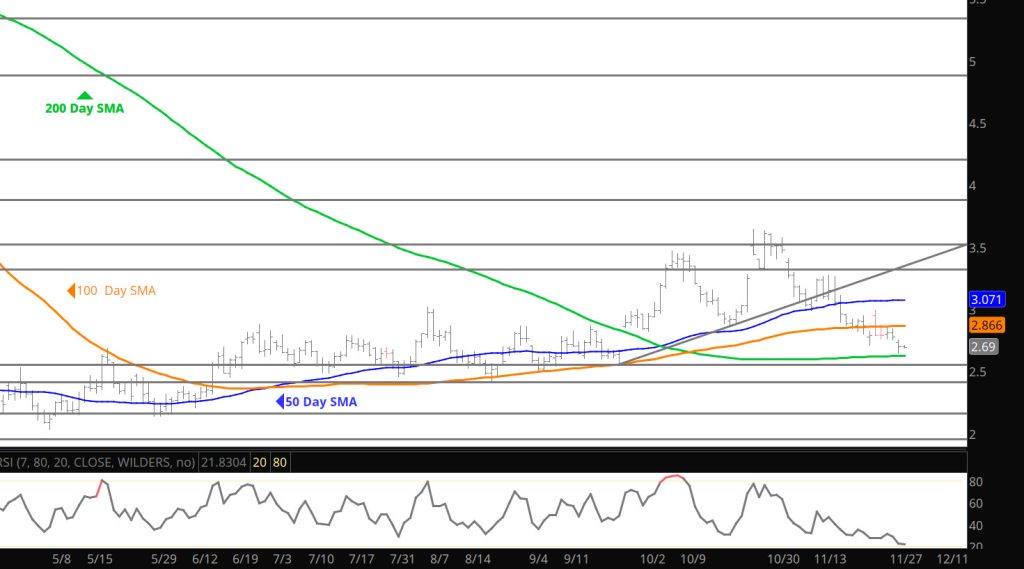
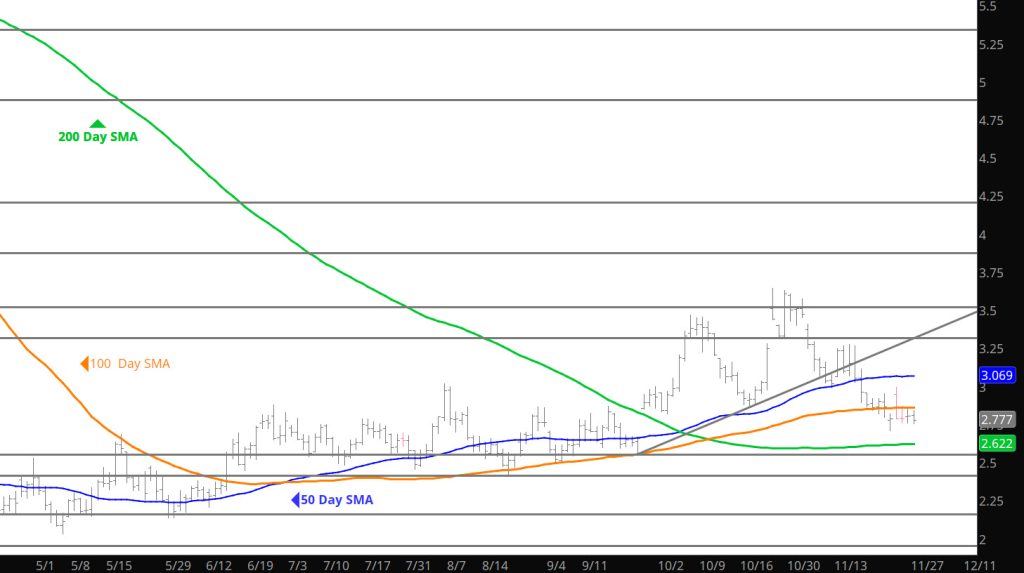
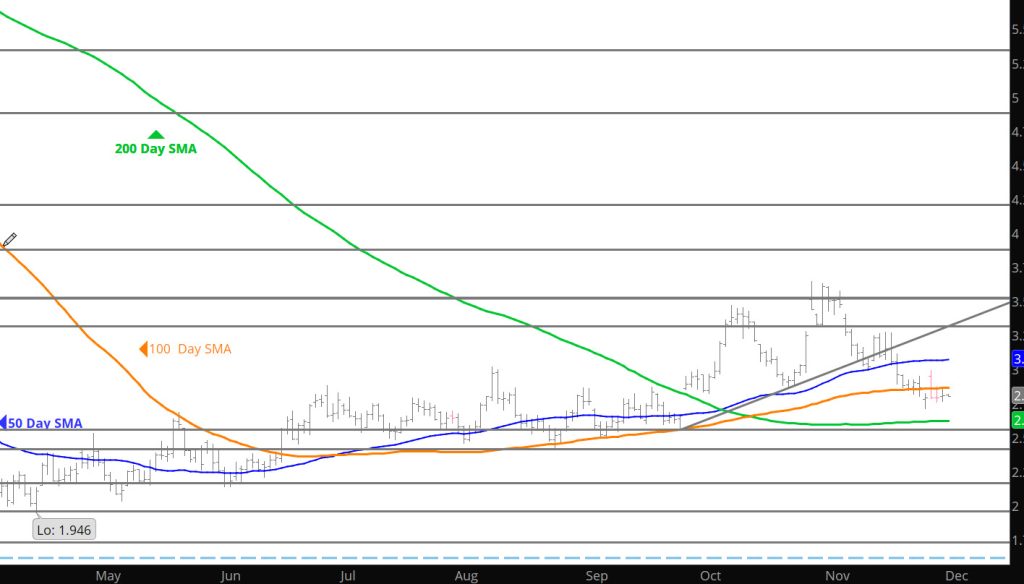
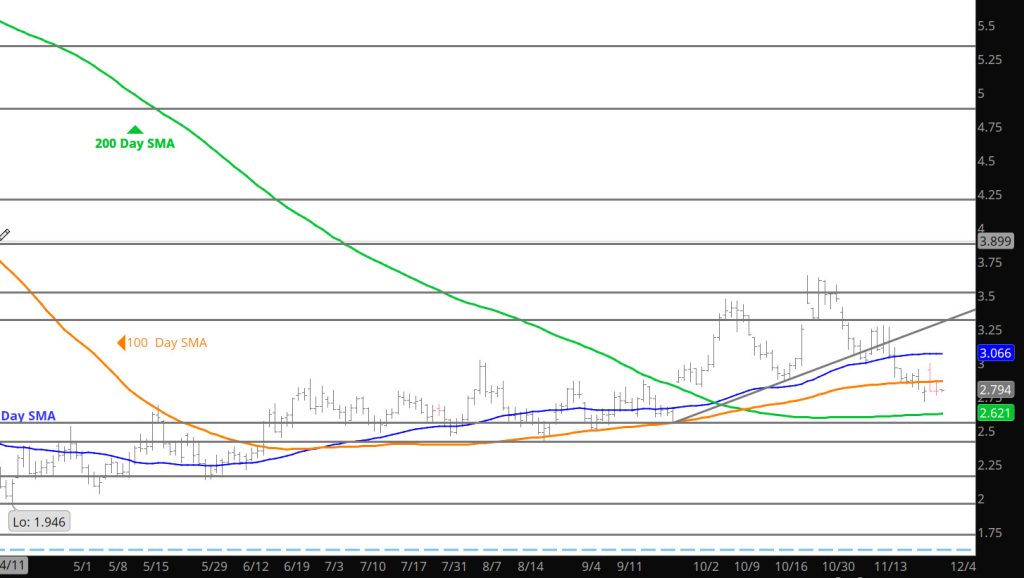
The chart above is from yesterday as I have lost my software to bring you the latest chart data. The market did close a little higher yesterday, not challenging the gap from Monday. Trade should be patient here until the price action defines itself.
Major Support:, $2.00, $1.991-$1.96, $1.795-$1.766 Minor Support $2.38-$2.26, $2.17 Major Resistance $2.45-$2.47, $2.786-$2.865, $3.00, $3.16, $3.48, $3.536, 3.59, $3.65
Not much to add — the RSI on the Daily and January charts are in the extreme over sold zones, the Bollinger study on the Weekly is testing 2 standard deviations under the 20 Week SMA, the Weekly RSI is starting to hit extreme levels — this is not a place where I am going initiate new short positions.
Major Support:, $2.00, $1.991-$1.96, $1.795-$1.766 Minor Support $2.38-$2.26, $2.17 Major Resistance $2.45-$2.47, $2.786-$2.865, $3.00, $3.16, $3.48, $3.536, 3.59, $3.65
To read The Daily Call you must be a subscriber (Current members sign in here. )
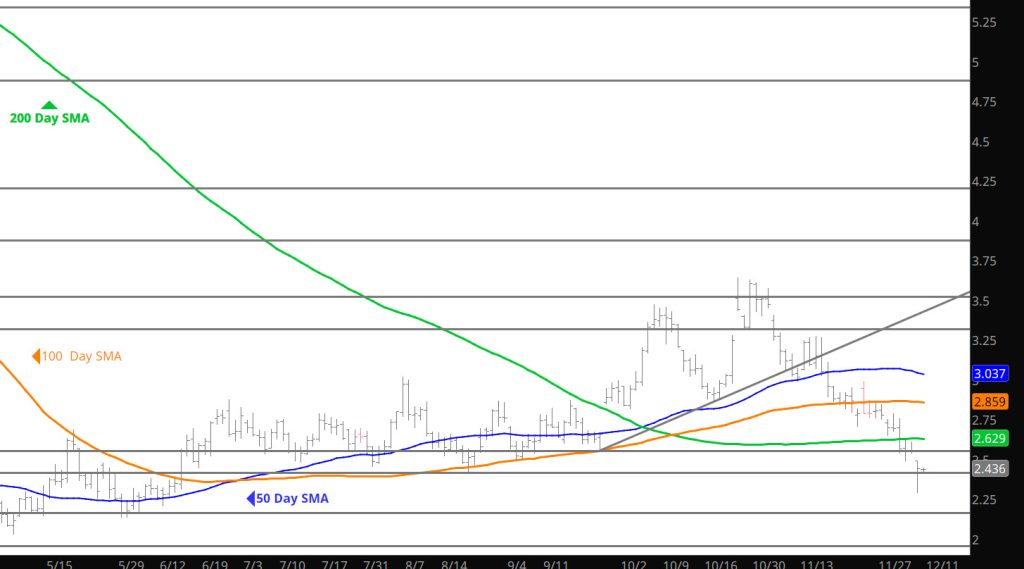
Not actually sure how to interpret yesterday’s action– prices open and gap lower only to have the declines extended during the early opening trade. This was followed by a continuous bullish bias during the day to finish just below the Sunday opening trade. Below the key area at $2.45-$2.47, I can’t call it a legitimate break down in prices due to the price action during the trade day. The follow through over the next couple of days will define a breakdown or fake.
Major Support: $2.47, $2.00, $1.991-$1.96, $1.795-$1.766 Minor Support $2.38-$2.26, $2.17 Major Resistance $2.786-$2.865, $3.00, $3.16, $3.48, $3.536, 3.59, $3.65
To read The Daily Call you must be a subscriber (Current members sign in here. )
Go into the reason for the $2.45-$2.47 being a critical area for the near term bias of prices in the Weekly section. I do find it interesting that this is the area the late Sunday night traded to.— Shocking. Spend the time to read the Weekly (less than 3 minutes). Other than that — lets see if we get a near term bias shift.
Major Support: $2.47, $2.00, $1.991-$1.96, $1.795-$1.766 Minor Support $2.38-$2.26, $2.17 Major Resistance $2.786-$2.865, $3.00, $3.16, $3.48, $3.536, 3.59, $3.65
If you are good at catching falling knives– get the gloves on. Extensions downward –putting prices below the extreme over sold levels on the RSI chart above,suggest that the closer the price gets to $2.48-$2.46 may be a good area to try and catch one with the stop at $2.45. Got no clue but that would break the series of high lows and higher highs.
Major Support: $2.608, $2.47, $2.00, $1.991-$1.96, $1.795-$1.766 Minor Support $2.38-$2.26, $2.17 Major Resistance $2.786-$2.865, $3.00, $3.16, $3.48, $3.536, 3.59, $3.65
To read The Daily Call you must be a subscriber (Current members sign in here. )
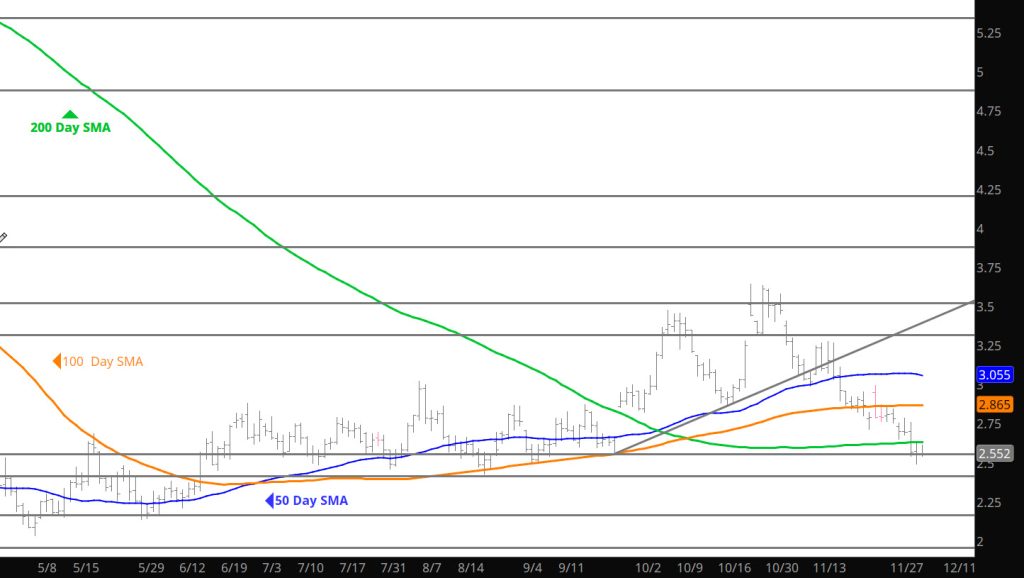
Prices took a day off of the declines, now seem to be consolidating the recent losses. Not convinced that the declines will not test the support from the bullish environment (since Apr ’22 — series of higher lows) around $2.47, but am not entering this market with length until it gives me a reason to.
Major Support:$2.82-$2.78, $2.74, $2.608, $2.47, $2.00, $1.991-$1.96, $1.795-$1.766 Minor Support $2.68, $2.38-$2.26, $2.17 Major Resistance $3.00, $3.16, $3.48, $3.536, 3.59, $3.65
To read The Daily Call you must be a subscriber (Current members sign in here. )
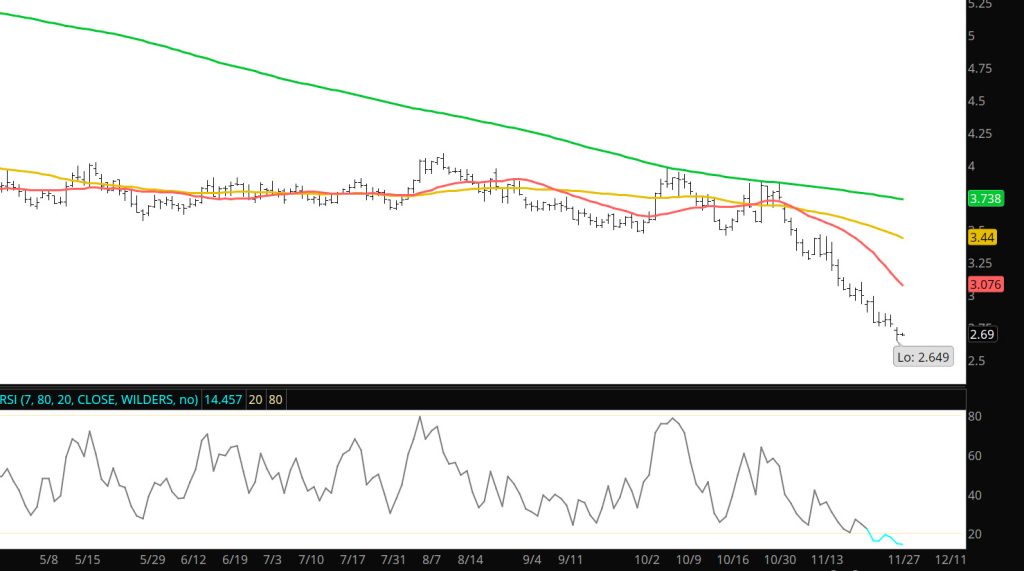
Had some questions yesterday when the market gaped lower on the open when it was over sold. Please remember that technical indications are usually based upon mathematics and one of the common indicators we use is the Relative Strength Indicator (RSI). As you will notice in the chart above — the RSI is approaching the lower level of 20 which indicates over sold. This does not mean it can’t go lower but notice on chart — it doesn’t stay there for long. Look at the chart below which is the Spot January chart which is well below 20 and is considered extremely over sold.
Daily Spot January Contract
Even though the technical indicator is under 20 — does not mean that it can’t go lower but how long it stays there is another question. When markets are extended to extreme levels — they are subject reversals that punish the late momentum players.
Am feeling a little better today and will work on the Weekly tomorrow.
Major Support:$2.74, $2.608, $2.47, $2.00, $1.991-$1.96, $1.795-$1.766 Minor Support $2.68, $2.38-$2.26, $2.17 Major Resistance $3.00, $3.16, $3.48, $3.536, 3.59, $3.65
Under the weather (so to speak) from my granddaughter’s virus — will be back on board (I hope) tomorrow — all I can say tonight is that prices are lower Sunday night and want to go lower.
Major Support:$2.82-$2.78, $2.74, $2.608, $2.47, $2.00, $1.991-$1.96, $1.795-$1.766 Minor Support $2.68, $2.38-$2.26, $2.17 Major Resistance $3.00, $3.16, $3.48, $3.536, 3.59, $3.65
To read The Daily Call you must be a subscriber (Current members sign in here. )
Was expecting prices to go down to the expiration level of the Dec contract — while close not quite ($2.68-$2.706). Starting to wonder with all the bearish fundamental (forecast data) built into the Jan contract — What is going to send it lower– don’t think technical data points will as they are starting to become over sold– would be hesitant to initiated significant bearish positions here.
Major Support:$2.82-$2.78, $2.74, $2.608, $2.47, $2.00, $1.991-$1.96, $1.795-$1.766 Minor Support $2.68, $2.38-$2.26, $2.17 Major Resistance $3.00, $3.16, $3.48, $3.536, 3.59, $3.65
To read The Daily Call you must be a subscriber (Current members sign in here. )
Bearish trade continues and would expect further declines on the storage report unless all the folks have already sold in anticipation. We shall see but it is not looking good for bullish positions.
Major Support:$2.82-$2.78, $2.74, $2.608, $2.47, $2.00, $1.991-$1.96, $1.795-$1.766 Minor Support $2.38-$2.26, $2.17 Major Resistance $3.00, $3.16, $3.48, $3.536, 3.59, $3.65
To read The Daily Call you must be a subscriber (Current members sign in here. )