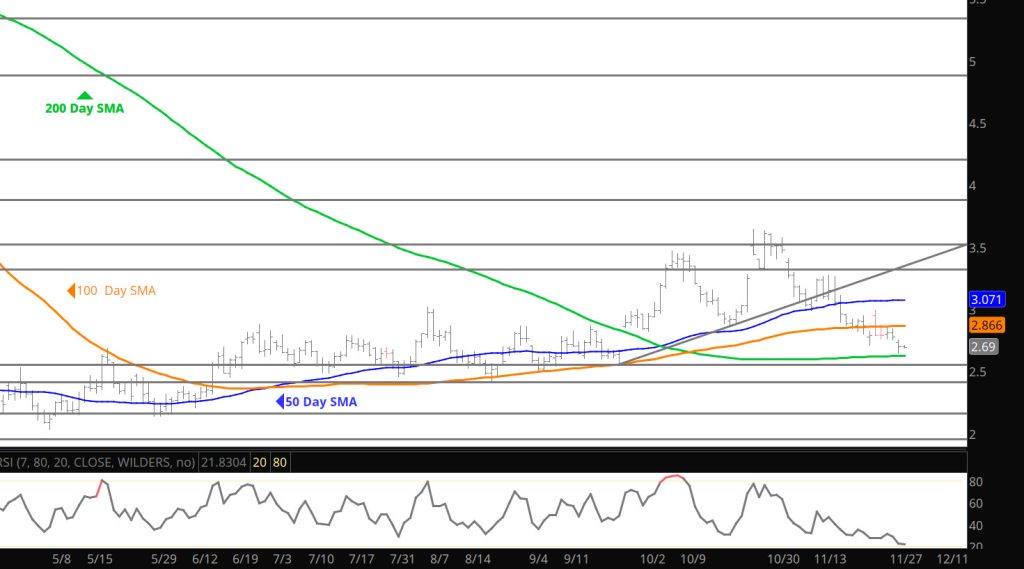
Daily Continuous with RSI
Had some questions yesterday when the market gaped lower on the open when it was over sold. Please remember that technical indications are usually based upon mathematics and one of the common indicators we use is the Relative Strength Indicator (RSI). As you will notice in the chart above — the RSI is approaching the lower level of 20 which indicates over sold. This does not mean it can’t go lower but notice on chart — it doesn’t stay there for long. Look at the chart below which is the Spot January chart which is well below 20 and is considered extremely over sold.
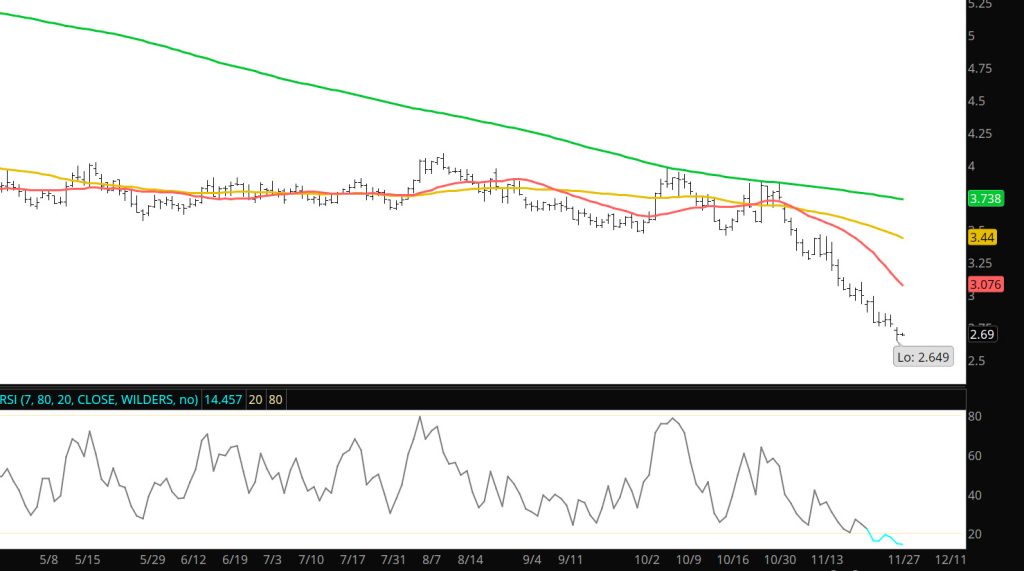
Daily Spot January Contract
Even though the technical indicator is under 20 — does not mean that it can’t go lower but how long it stays there is another question. When markets are extended to extreme levels — they are subject reversals that punish the late momentum players.
Am feeling a little better today and will work on the Weekly tomorrow.
Major Support:$2.74, $2.608, $2.47, $2.00, $1.991-$1.96, $1.795-$1.766
Minor Support $2.68, $2.38-$2.26, $2.17
Major Resistance $3.00, $3.16, $3.48, $3.536, 3.59, $3.65