More Sunday Silliness

Daily Continuous

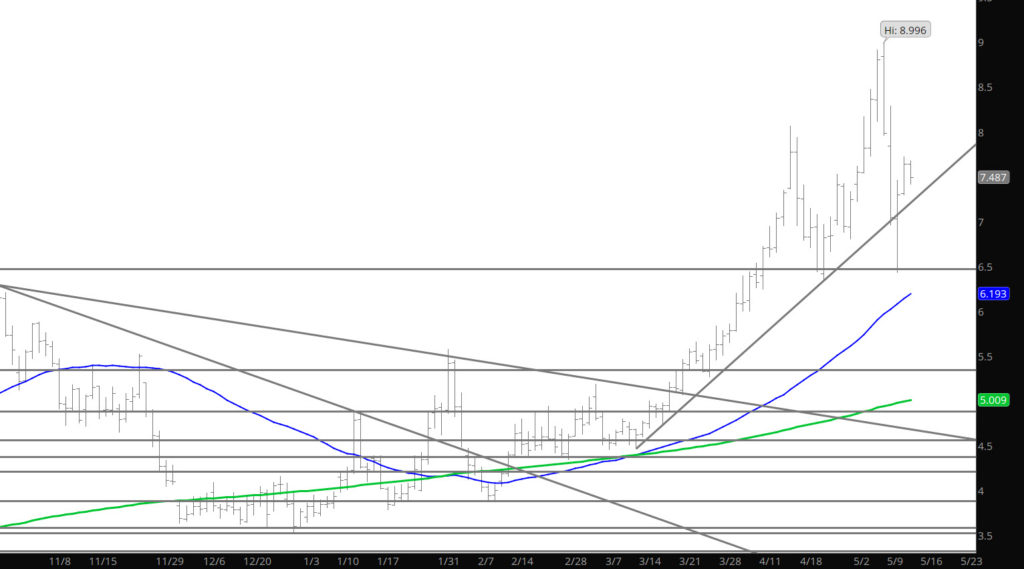
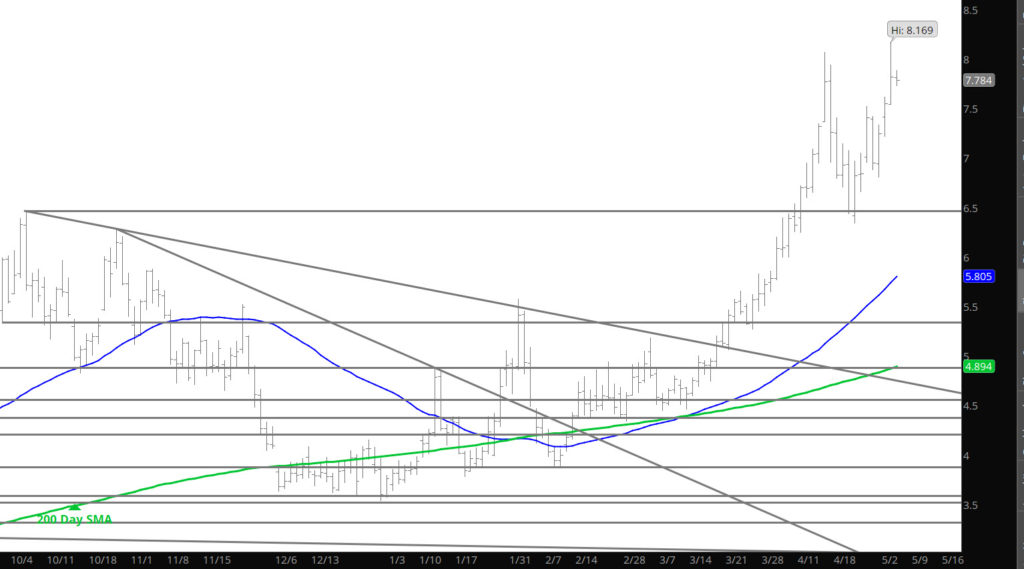
Not sure what fundamental news forced price up to $7.872, but that is what happened last night on the open. Refer to it as light trade silliness with trade trying to force some sort of reaction when the trade is light and easily effected. Was provided some interesting analysis from a good friend that was put in the Weekly section– going to give you a choice of what will be occurring in the near future.

For over a year every prompt contract has weakened around mid life as prompt in its tenure– perhaps that’s what we saw this week. May fell 28.5% from the 05/06 high to the 5/10 low. That was the most since the January contract fell 34% just after December expiration. March fell 22% after the spike into February expiration to the earliest pre – expiration low of the last 14 months (02/11). Expect prompt June to continue the trend of supported prices into expiration. There may be some additional losses prior to the historical monthly prompt trend, expect those to be short lived.

To read The Daily Call you must be a subscriber (Current members sign in here. ) Start your subscription today.

Consolidation Continues Correction

Daily Continuation

Love the occasional text messages from you all– yesterday a comment from an older client struck me with his limited analytic capacity as he wanted to challenge my use of the word “consolidation” describing the trade. Consolidation is a term in reference to the volatility during the day– The last two days of trade have had ranges of $.53+and $.42+ which are well below the ranges since the beginning of the month between $.60-$1.32+. Is this consolidation– yes — is the range greater than when prices were consolidating around $4.00 between $.15-$.30– yes. The key is the level the price is at compared to the recent history of trade. Another interesting comment that I received from a couple of readers and they were mentioning that consolidation would leave to another decline downward. I can not subscribe with that theory– periods of consolidation occurs to set up the next move whether it is up or down. The recent reversals downward may suggest a break down — but I would also submit that the general bias in this market remains bullish having reversed off of highs only to test support at major support ($6.40) only to fail and rebound to where we are.

Major Support:, $7.00-$6.855, $6.411-$6.392, $6.247-$6.278, $5.27-$5.199, $5.001, $4.40-$4.26, $4.187
Minor Support: $6.00, $5.063, $5.04, $4.88, $4.60-$4.557
Major Resistance:
$8.47-$9.60

To read The Daily Call you must be a subscriber (Current members sign in here. ) Start your subscription today.

Rally Gets Smacked

Daily Continuous
Spot June Contract

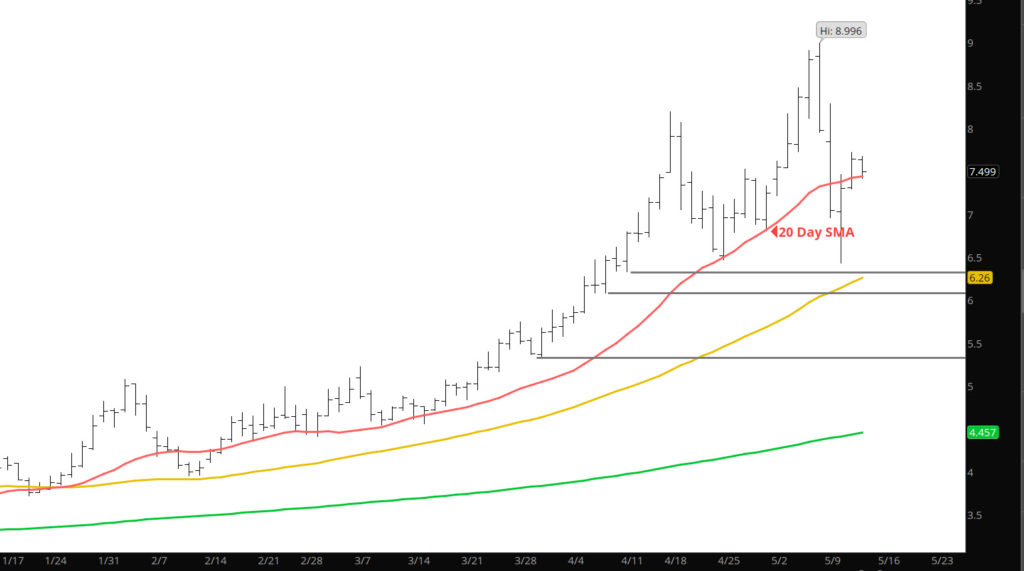
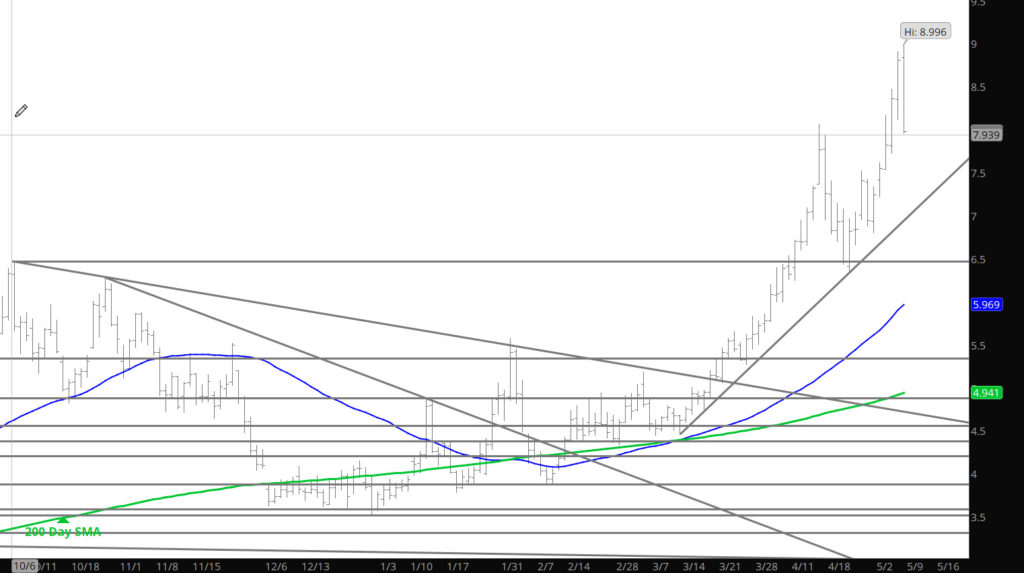
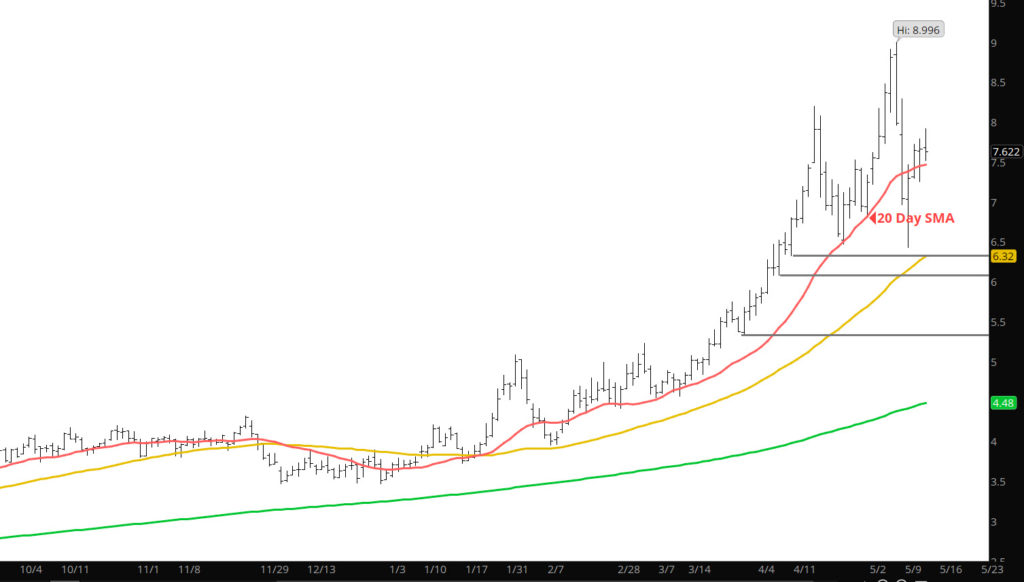
You will notice that the 20 day SMA of the June Contract was broken during trade yesterday only to be tested as support late last night. This area (up to the trend line in the Continuous chart above) will likely hold the trade during the week (without some surprising data on storage). This may provide the long awaited consolidation trade that I have been looking for rather than the $.40 trade ranges of late. We shall see.

Major Support:, $7.00-$6.855, $6.411-$6.392, $6.247-$6.278, $5.27-$5.199, $5.001, $4.40-$4.26, $4.187
Minor Support: $6.00, $5.063, $5.04, $4.88, $4.60-$4.557
Major Resistance:
$8.47-$9.60

To read The Daily Call you must be a subscriber (Current members sign in here. ) Start your subscription today.

Here We Go Again?

Daily Continuous

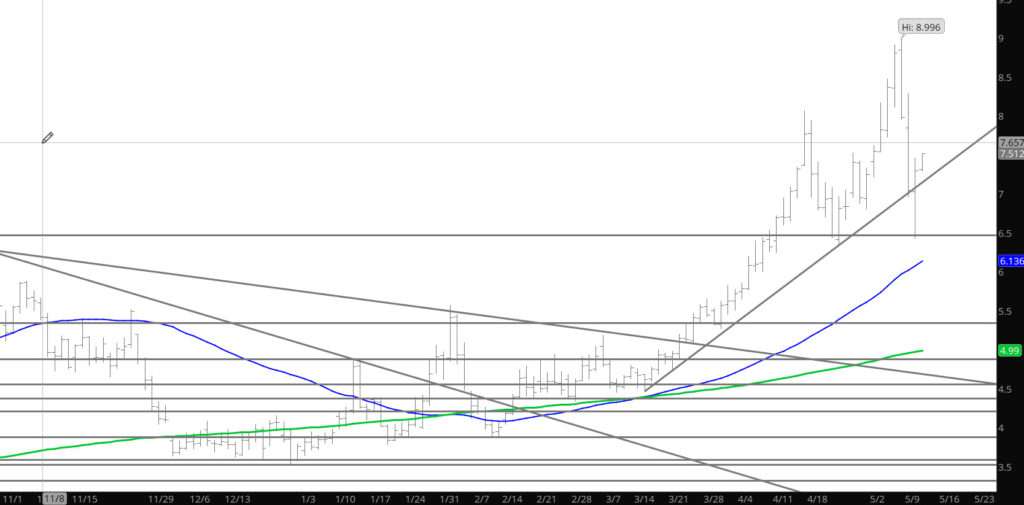
As suggested yesterday – prices went down to test the major support area but instead of developing a consolidation range, the market decided to run back up to and break the trend line and the 20 day SMA of the prompt June contract as discussed earlier. This volatility is wild when the range is near a $1.00 from low to high. Keep trades active for the day but don’t expect longer term gains from length or shorts in this environment.

Major Support:, $7.00-$6.855, $6.411-$6.392, $6.247-$6.278, $5.27-$5.199, $5.001, $4.40-$4.26, $4.187
Minor Support: $6.00, $5.063, $5.04, $4.88, $4.60-$4.557
Major Resistance:
$8.47-$9.60

To read The Daily Call you must be a subscriber (Current members sign in here. ) Start your subscription today.

Declines Accelerated

Daily Continuation

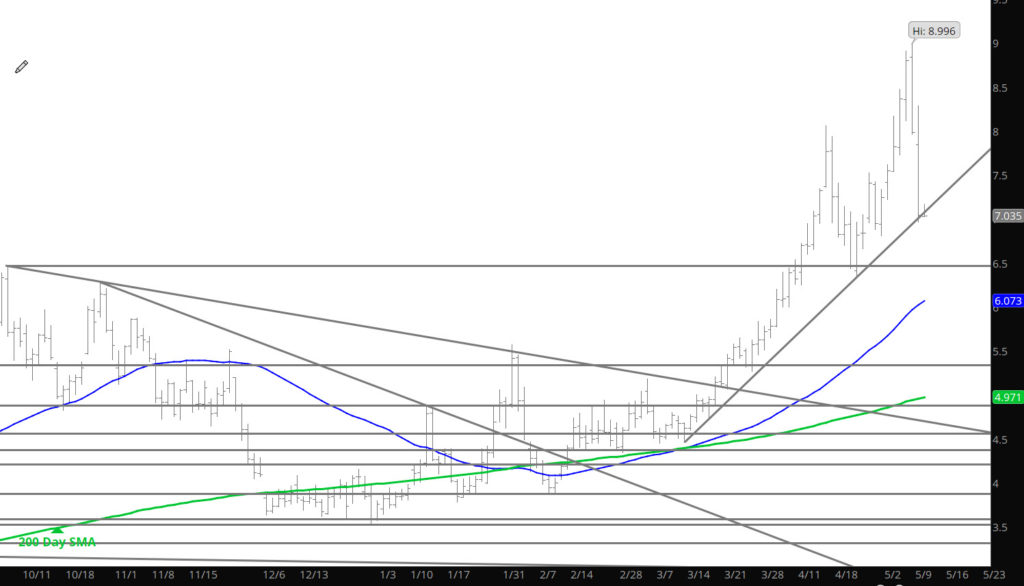
Prices continued from where they ended on Friday and lost another 12% yesterday taking the prompt below $7.00 (though that level was holding in the late trade). Now prices could settle in and try some consolidation but don’t hold your breath. The trend line on the Daily Chart will likely give us some short term directional bias. This support zone (trend line) may hold down to $6.40 will create the bottom side of the range for the remainder of May.

Major Support:, $7.00-$6.855, $6.411-$6.392, $6.247-$6.278, $5.27-$5.199, $5.001, $4.40-$4.26, $4.187
Minor Support: $6.00, $5.063, $5.04, $4.88, $4.60-$4.557
Major Resistance:
$8.47-$9.60

To read The Daily Call you must be a subscriber (Current members sign in here. ) Start your subscription today.

Reversal in Prices — Provides Little Medium Term Impact

Daily Continuous

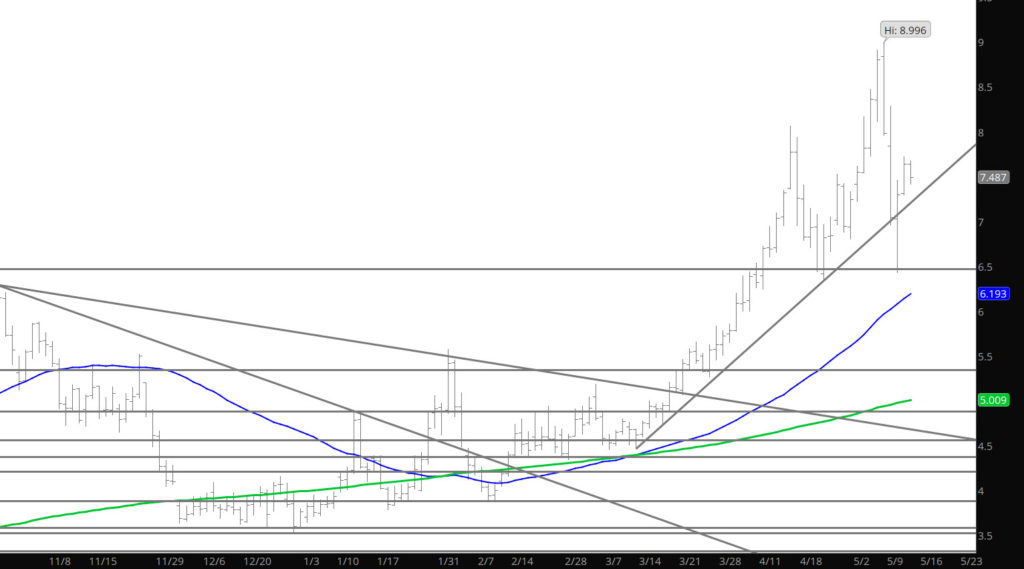
Went into the near term trends associated with last week’s reversal in the Weekly section for your review. Even with the $1.00 decline off of the highs on Friday — the marker remains with a bullish bias (last week closed significantly higher even with the decline). While strength on the open may occur — prices are headed for some consolidation and Friday does not reflect consolidation – rather profit taking. For well more than a year every prompt contract has weakened around mid month in its tenure, the earliest was March that traded its pre – expiration low on 02/11; the latest was May which fell from a 04/18 high at 8.065 to a 04/25 low of 6.345. Expect this June’s role as prompt to remain consistent with that pattern.

Major Support:, $7.00-$6.855, $6.411-$6.392, $6.247-$6.278, $5.27-$5.199, $5.001, $4.40-$4.26, $4.187
Minor Support: $6.00, $5.063, $5.04, $4.88, $4.60-$4.557
Major Resistance:
$8.47-$9.60

To read The Daily Call you must be a subscriber (Current members sign in here. ) Start your subscription today.

Prices Reverse Off of A 13 Year High Trade
Weekly Continuous

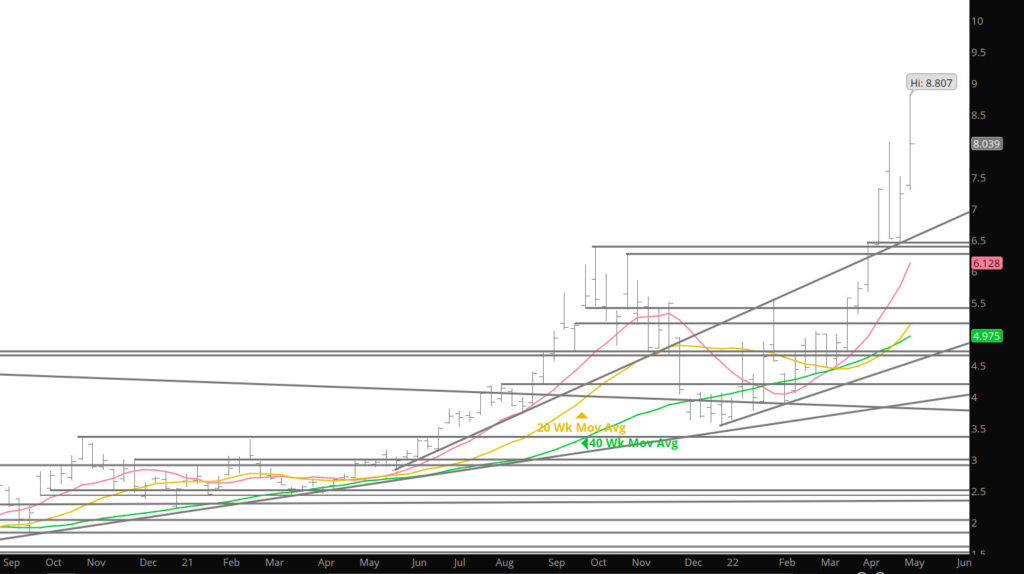
Prompt May extended the rally from the previous meager test of its 20 – day SMA for six straight trading days, rising $2.191, before reversing. On Friday May fell more than a dollar from the highest price traded in 13+ years and ended the week back below the April high (perhaps significant). Despite the decline during Friday’s outside day reversal, prompt gas still finished the week $.799 higher.

The gas market is extremely overbought by most all of my metrics. The weekly MACD the primary lagging indicator (used sparingly here but monitored on an every week basis for the last thirty years) has exceeded its extreme reading coincident with last year’s high. Simultaneously, the weekly RSI, the primary leading indicator, is yet to confirm the April high (RSI should confirm the weekly high with a higher close).

Prompt gas is extended more than 50% above the intermediate long – term trend defining 40 – week SMA. Since (and including ’00) this is the ninth time prompt gas has been extended this far. Currently, separation from the rising moving average measures 60.8%. Last fall weekly closing prices remained more than 50% above the moving average for seven weeks and at the peak the separation was 67.5% before the decline toward the December low began. The one factor that each of the prior occurrences has in common is that once the regression begins the decline to the mean is rapid. Ten weeks after last fall’s peak extension prompt gas closed below the 40 – week SMA.

Prompt gas traded to three standard deviations above the twenty – week SMA for the third time in four weeks. Last fall there was a nearly identical sequence before prompt gas returned to the 20 – week SMA. Markets in definable trends typically respect shorter term moving averages. Without exception, every expiring contract for more than a year has settled above its 20 – day SMA. More often than not that relatively short–term moving average has been tested and held during the middle of the prompt and presenting a low risk buying point. Expect June to test its 20 – day during its tenure, before a rally into expiration.

Whether the short–term moving average continue to provide supports they did for prompts April and May, the most important factor is the long series of higher highs and higher lows that define the uptrend (discussed here for over two years) see chart below. Despite a weekly reversal from the April high and a decline from high to low of more than $1.70, prompt gas came nowhere near breaking that pattern. Violation of that April low ($6.345) would suggest a change in character for the gas market. Continue to expect prompt gas and the strips to find support above prior significant lows.
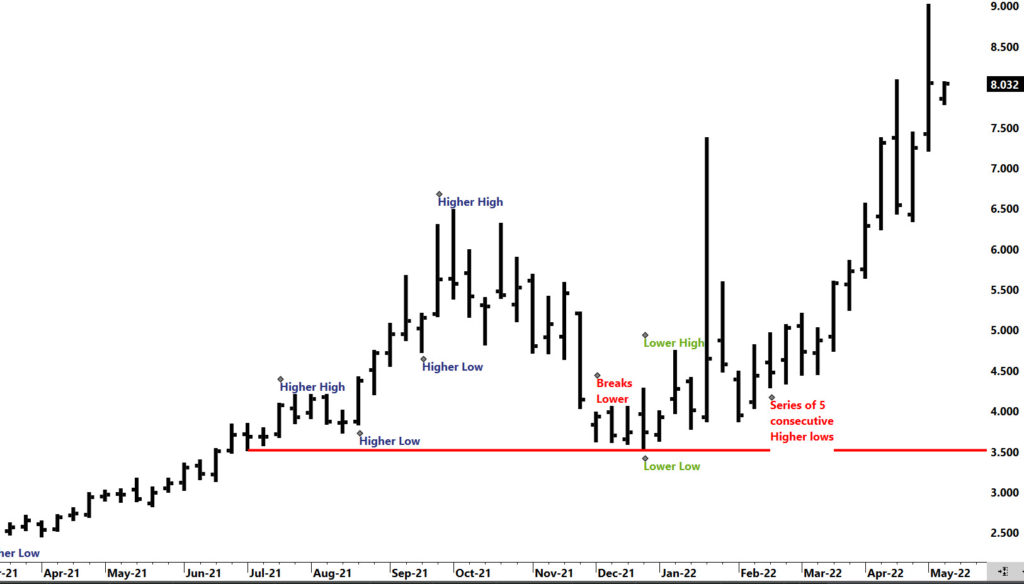
Weekly Continuous — Higher Highs and High Lows

Major Support:, $7.00-$6.855, $6.411-$6.392, $6.247-$6.278, $5.27-$5.199, $5.001, $4.40-$4.26, $4.187
Minor Support: $6.00, $5.063, $5.04, $4.88, $4.60-$4.557
Major Resistance:
$8.47-$9.60

Been Here Before
Daily Continuous

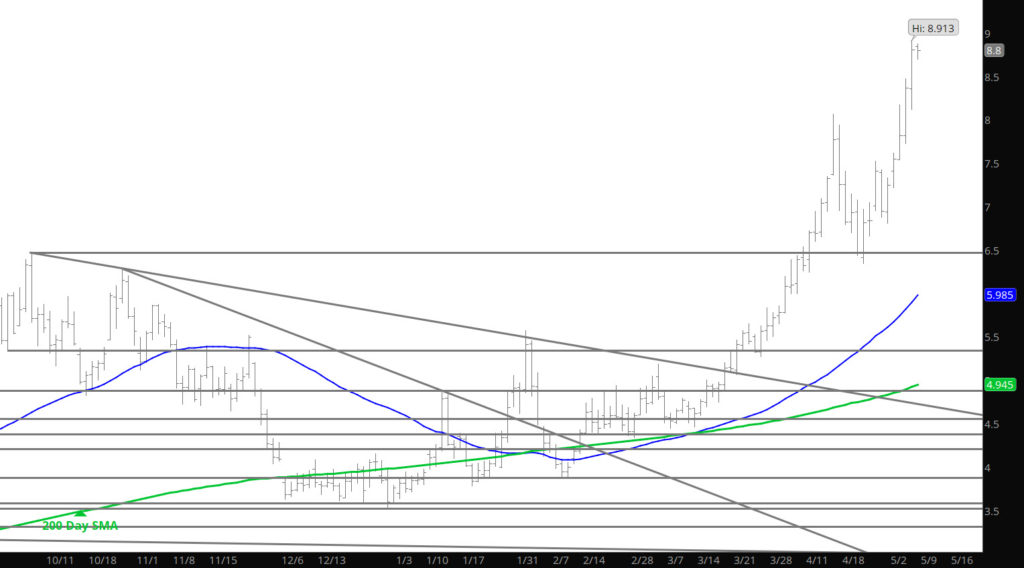
We were in a very similar position a couple of weeks ago, if you remember the chart below:
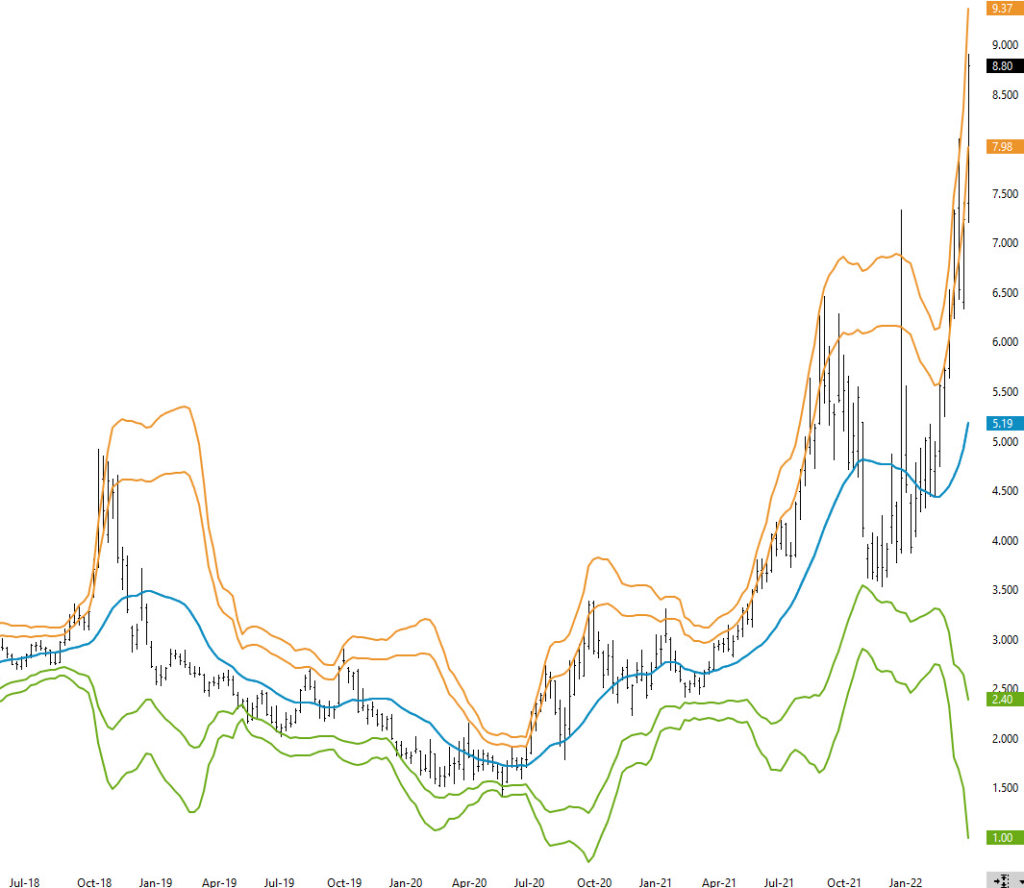
Weekly Continuous with Bollinger Study at 2 &3 Standard Deviations over the 20 Week SMA

When prices extend nearly three standard deviations above the 20 WK SMA– it is over cooked. Last time (last month) prices corrected nearly 20% before finding support. Not calling this the high, as prices can continue well beyond technical points — but trust me — there will be a correction. If you are playing this with length — rock and roll, I have retired from playing this market (even on a daily play) until some of the silliness recedes. BTW — I thought that was a bearish storage report — that is why I don’t trade on fundamental data points.

Major Support:, $7.00-$6.855, $6.411-$6.392, $6.247-$6.278, $5.27-$5.199, $5.001, $4.40-$4.26, $4.187
Minor Support: $6.00, $5.063, $5.04, $4.88, $4.60-$4.557
Major Resistance:
$8.47-$9.60

This Getting Too Rich

Daily Continuous

So prices reverse on Tuesday only to reverse on Wednesday another $.70+ gain from the lows on Wednesday. Anyone else beginning to smell something fishy associated with this run. Though it was still a higher high, regardless of the cod, and there doesn’t seem to be any price that is not worth buying from a risk standpoint. Pardon me, do it with your money as I will continue to intra day position and be out by the end of the day.

Major Support:, $7.00-$6.855, $6.411-$6.392, $6.247-$6.278, $5.27-$5.199, $5.001, $4.40-$4.26, $4.187
Minor Support: $6.00, $5.063, $5.04, $4.88, $4.60-$4.557
Major Resistance:
$8.47-$9.60
To read The Daily Call you must be a subscriber (Current members sign in here. ) Start your subscription today.

Another Reversal After Clearing $8.00

Daily Continuous

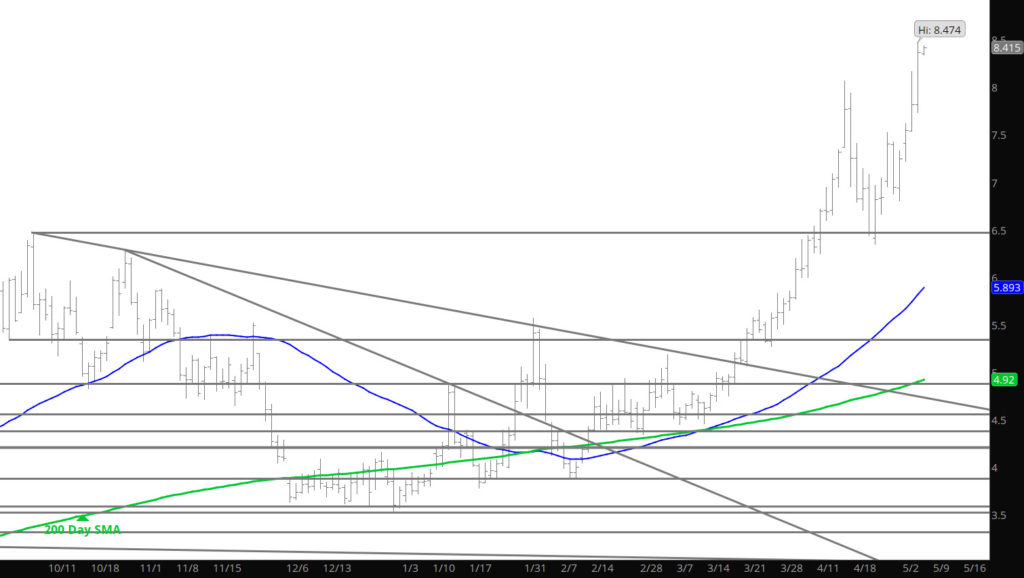
A reversal yesterday after prices rallied above $8.00 to set a new high in this series of higher highs that the market is performing. Now — what — for the reversal to be more significant, the declines will need to continue and not find as many buyers at support (say $7.00). Wait and watch this week– play the day to day game and would not leave positions out there for several days.

Major Support:, $7.00-$6.855, $6.411-$6.392, $6.247-$6.278, $5.27-$5.199, $5.001, $4.40-$4.26, $4.187
Minor Support: $6.00, $5.063, $5.04, $4.88, $4.60-$4.557
Major Resistance:
$7.536, $8.065

To read The Daily Call you must be a subscriber (Current members sign in here. ) Start your subscription today.