To read The Daily Call you must be a subscriber (Current members sign in here. ) Start your subscription today.
Author: Willis Bennett
Give and Take
To read The Daily Call you must be a subscriber (Current members sign in here. ) Start your subscription today.
So Much For Consolidation
To read The Daily Call you must be a subscriber (Current members sign in here. ) Start your subscription today.
Market Acts Like a Consolidation Phase
To read The Daily Call you must be a subscriber (Current members sign in here. ) Start your subscription today.
Solid Rebound
To read The Daily Call you must be a subscriber (Current members sign in here. ) Start your subscription today.
Prices Look to A Rebound
To read The Daily Call you must be a subscriber (Current members sign in here. ) Start your subscription today.
Near Term Support Holds For Now
To read The Daily Call you must be a subscriber (Current members sign in here. ) Start your subscription today.
Consolidation After Major Declines?
To read The Daily Call you must be a subscriber (Current members sign in here. ) Start your subscription today.
Conforming With Labor Day Weakness
To read The Daily Call you must be a subscriber (Current members sign in here. ) Start your subscription today.
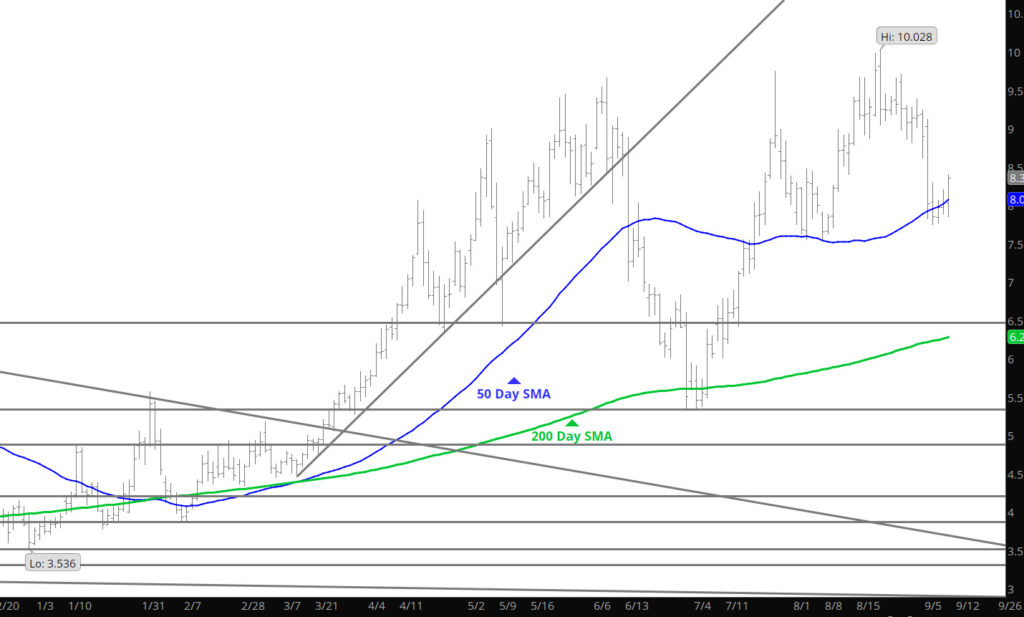
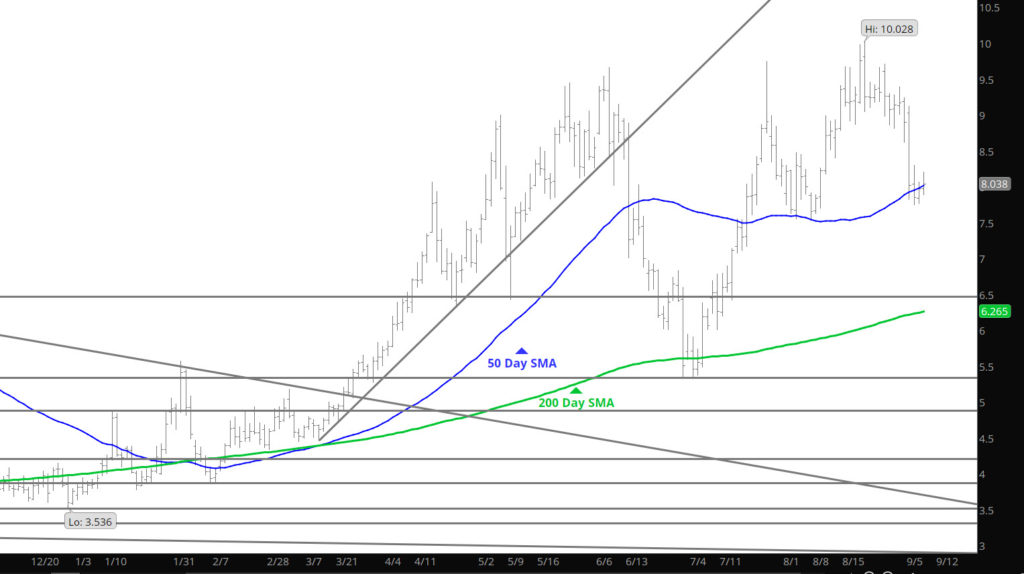
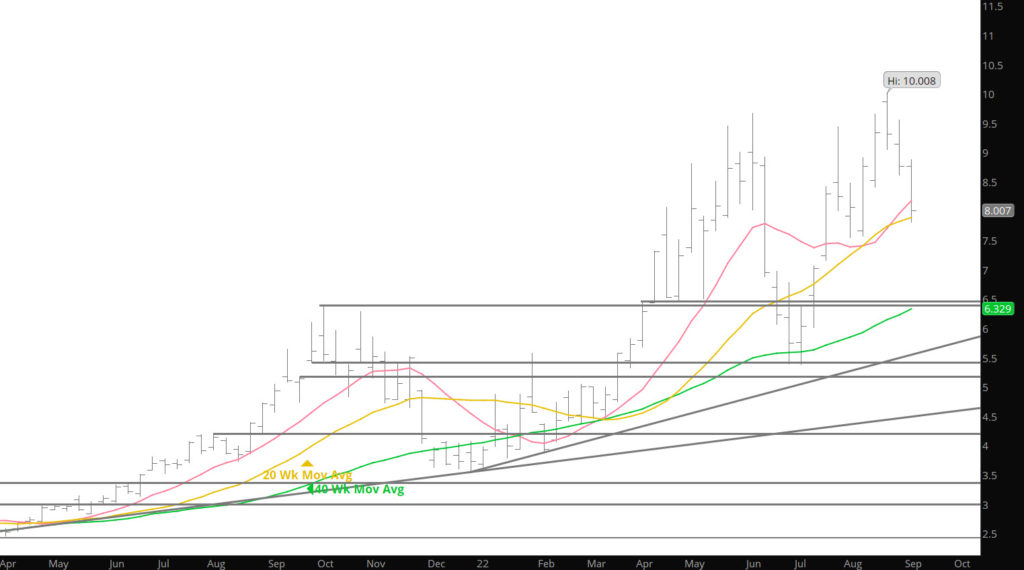
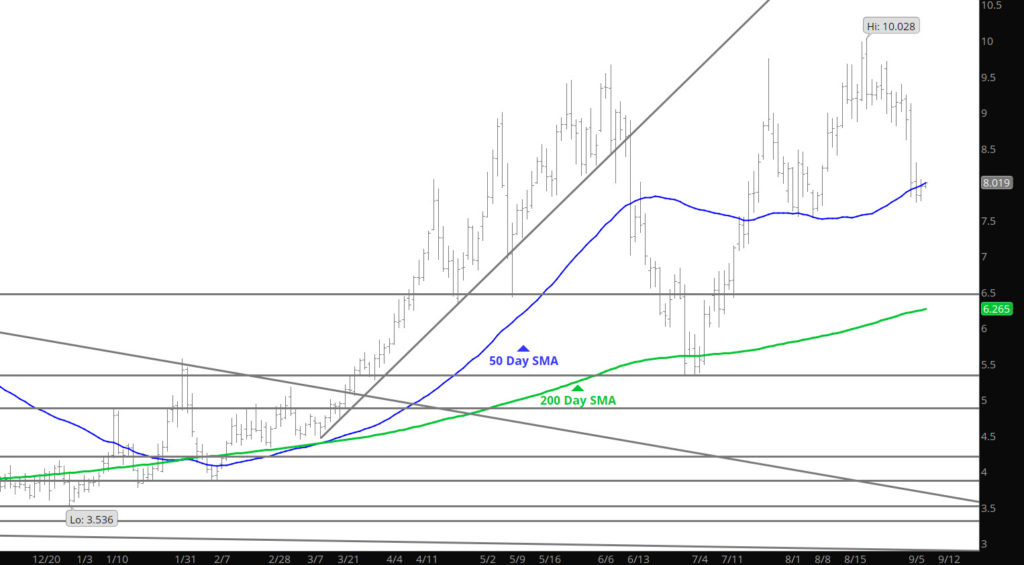
Now That Is An Extension
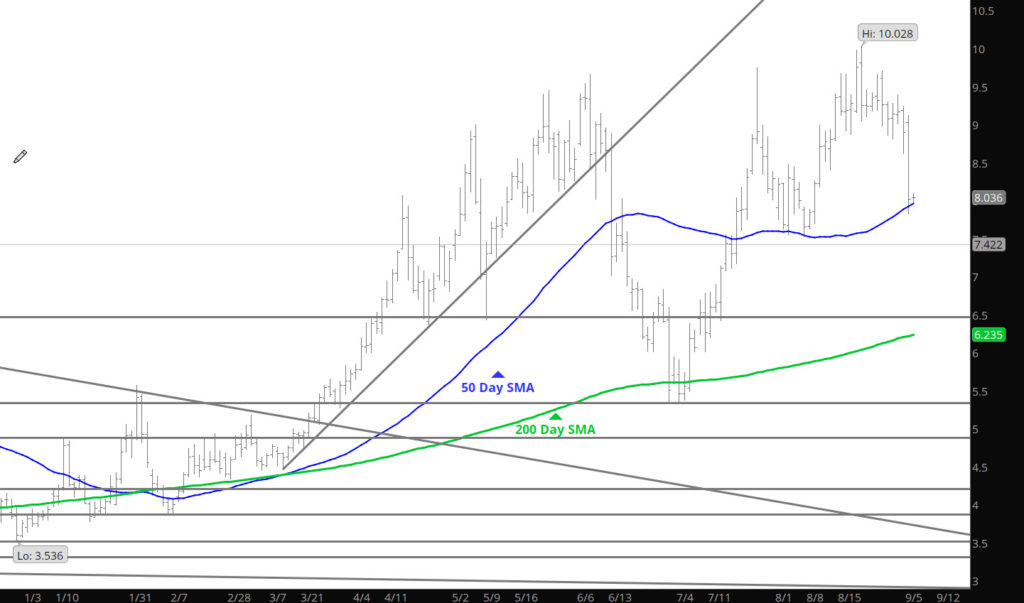
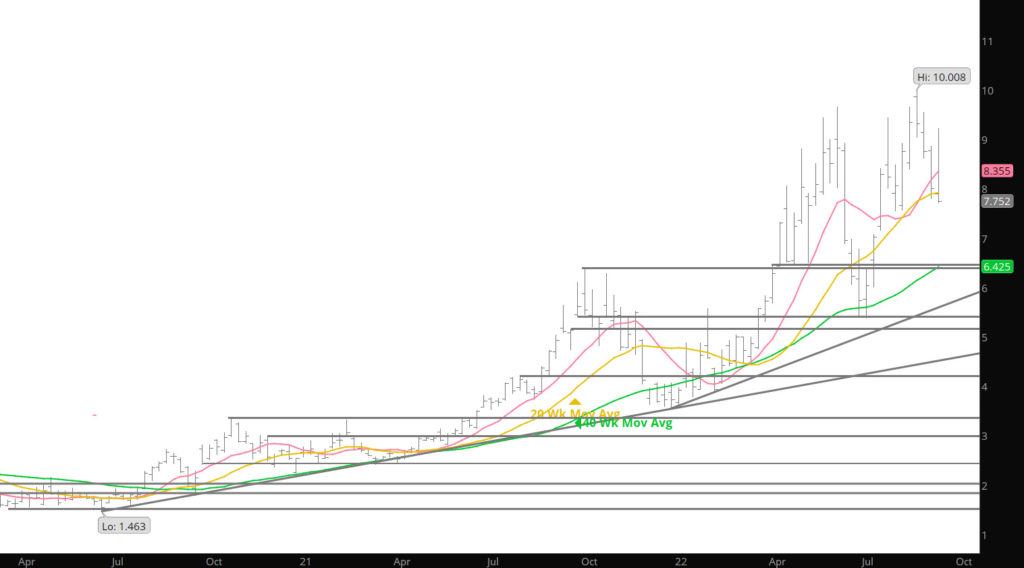
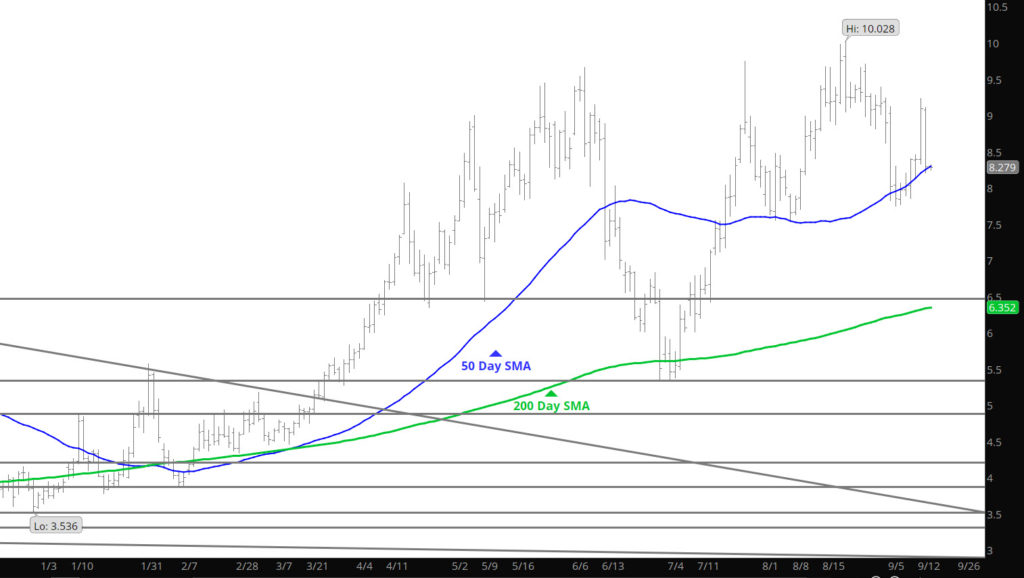
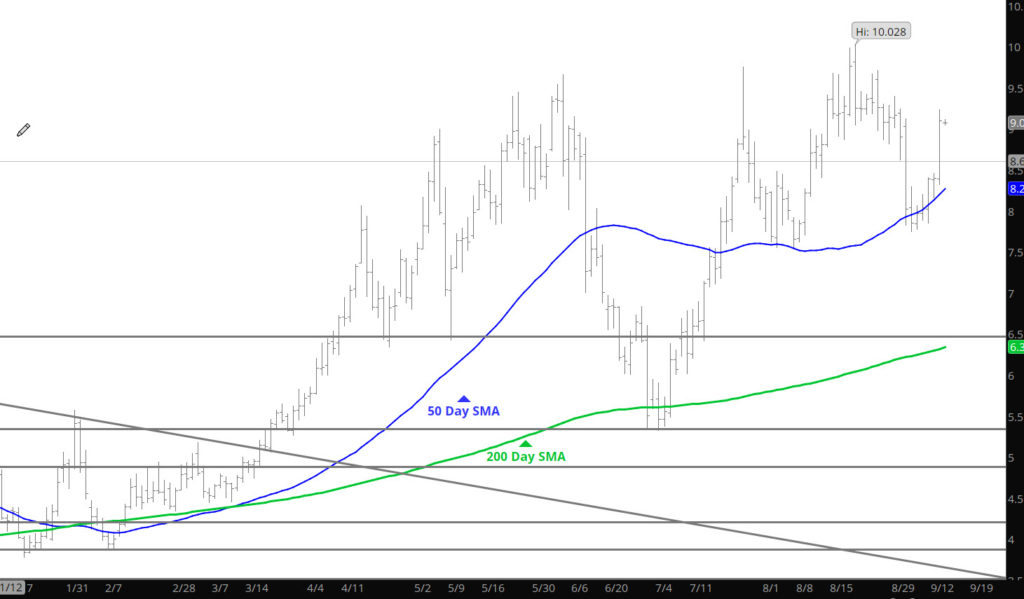
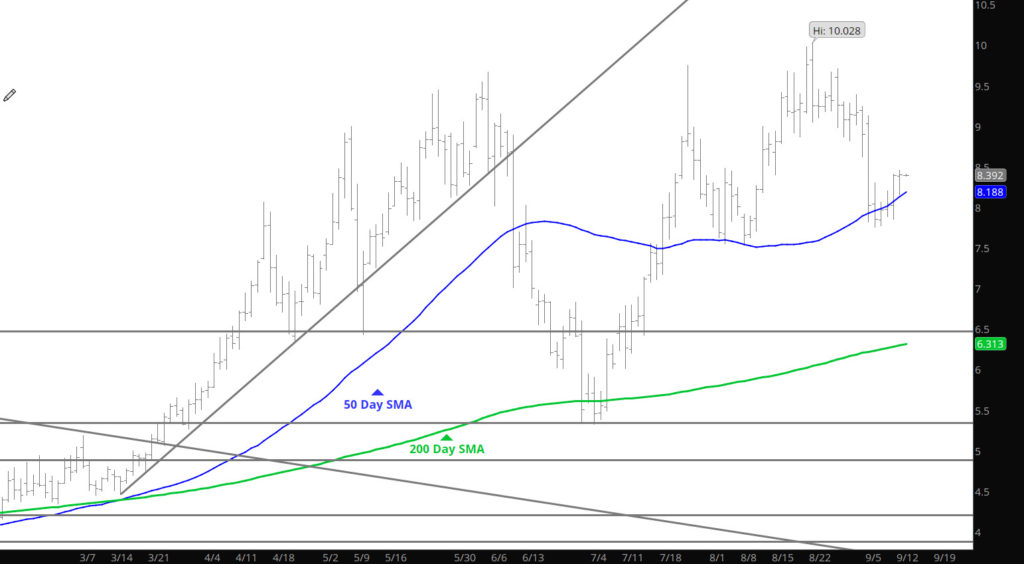
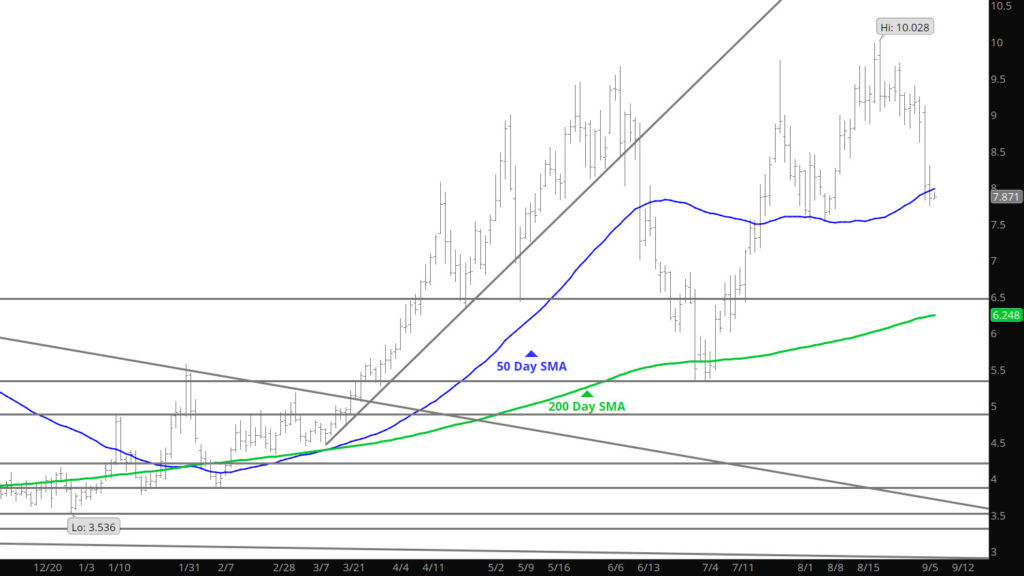
Prices continued the extension of the declines, as prompt dipped below $8.00 briefly, challenging the 50 day SMA and attacked the 20 Week SMA that have been well held support zones lately. The key will be how does the market respond on this test. If support holds then the range up to $9.00 remains, a break down below will suggest the lows of early August around $7.50 are in target.
Major Support: $7.956-$7.91, $7.55, $7.14, $7.078, $6.88, $6.754,$6.38, $6.02, $5.623,
Minor Support $7.35, $7.41, $6.42, $5.548, $5.40-$5.45
Major Resistance: $8.58-$8.61, $9.021, $9.35, $9.40, 9.664–$9.67, $9.98