To read The Daily Call you must be a subscriber (Current members sign in here. ) Start your subscription today.
Author: Willis Bennett
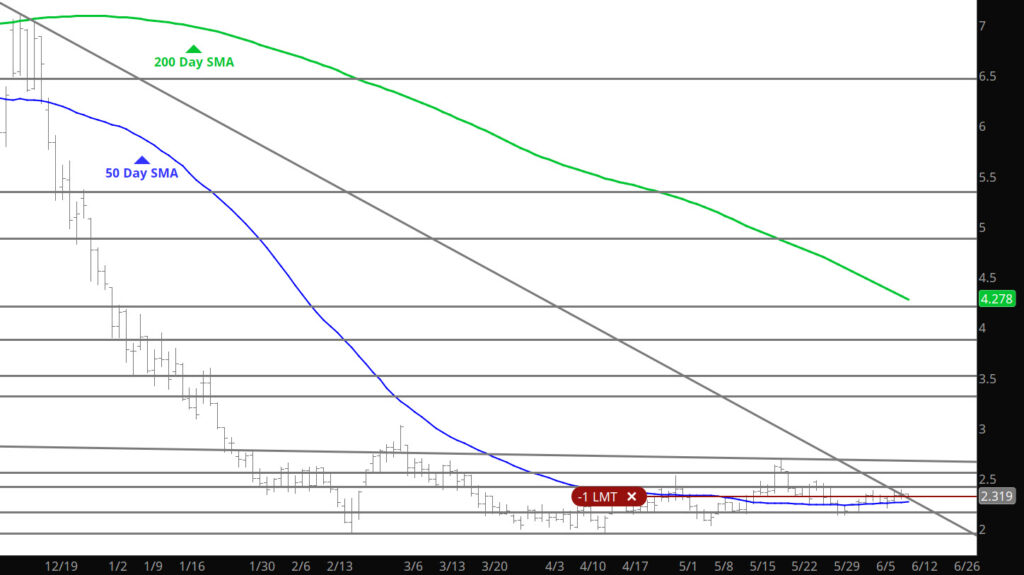
Daily Close Above Declining Trend Line
To read The Daily Call you must be a subscriber (Current members sign in here. ) Start your subscription today.
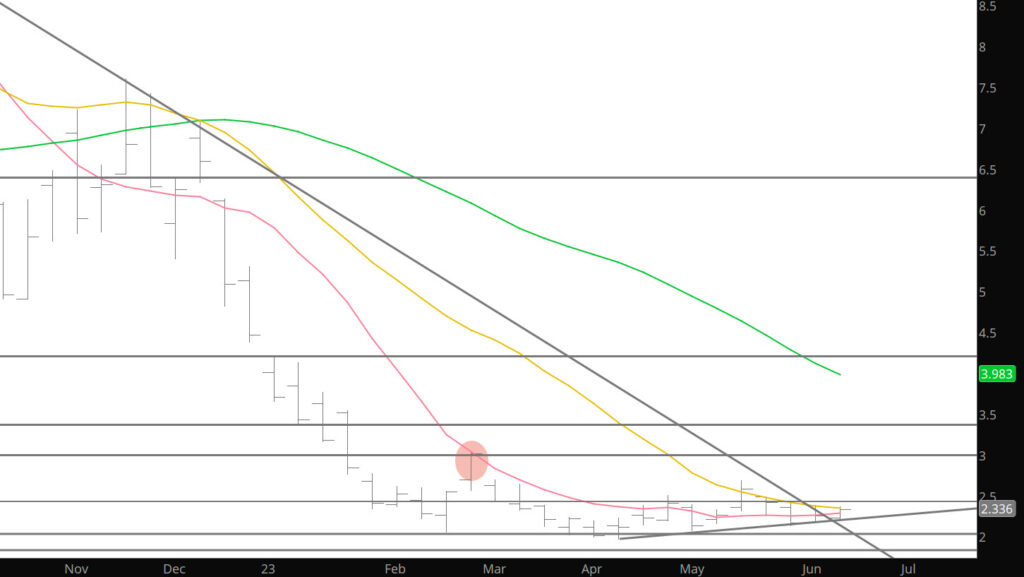
Trend Lines Hold
To read The Daily Call you must be a subscriber (Current members sign in here. ) Start your subscription today.
Higher Weekly Close
To read The Daily Call you must be a subscriber (Current members sign in here. ) Start your subscription today.
Issues Await
To read The Daily Call you must be a subscriber (Current members sign in here. ) Start your subscription today.
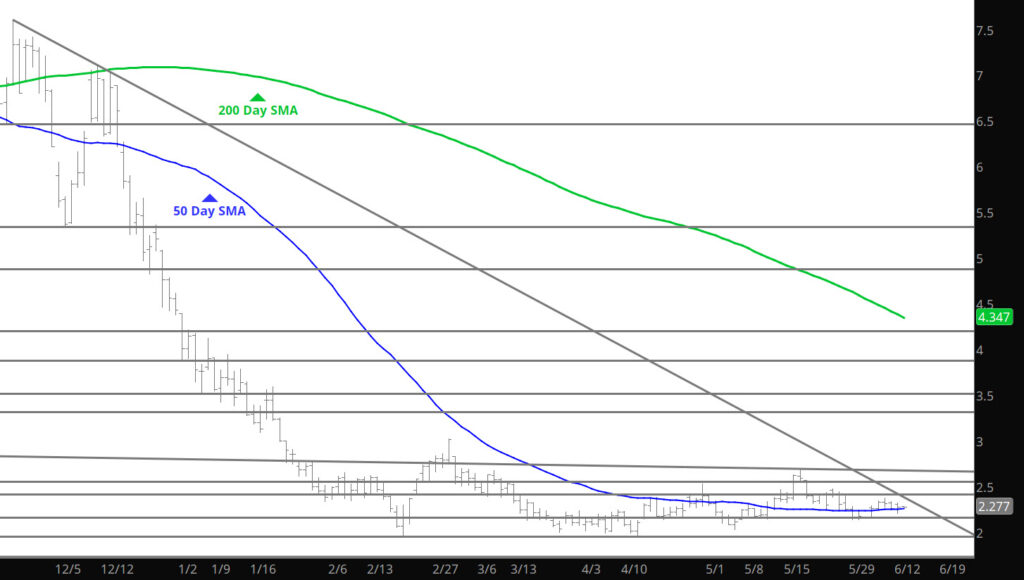
No Bias Change Indication
To read The Daily Call you must be a subscriber (Current members sign in here. ) Start your subscription today.
Prices Push Higher
To read The Daily Call you must be a subscriber (Current members sign in here. ) Start your subscription today.
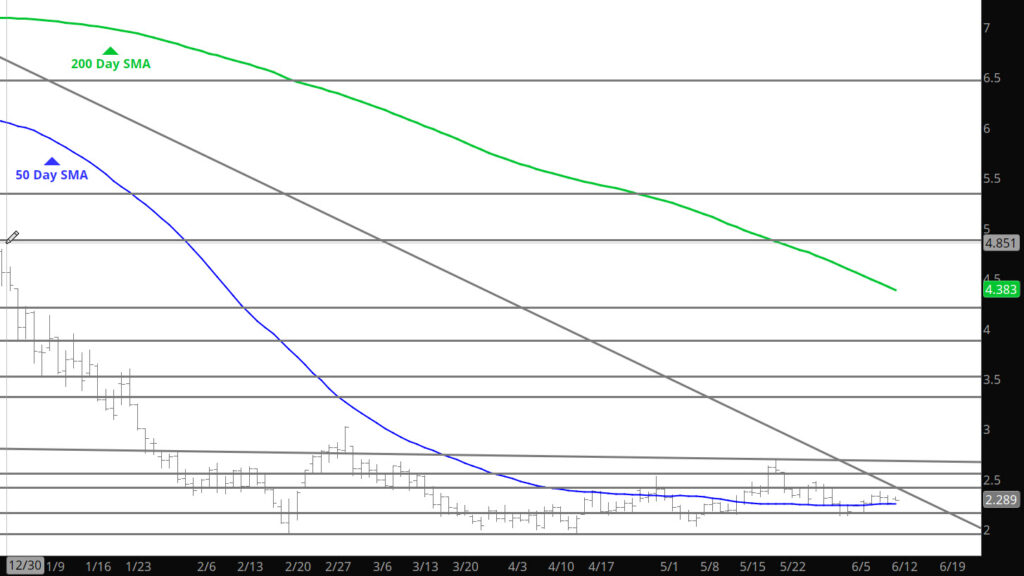
Consolidation In a Narrow Range
To read The Daily Call you must be a subscriber (Current members sign in here. ) Start your subscription today.
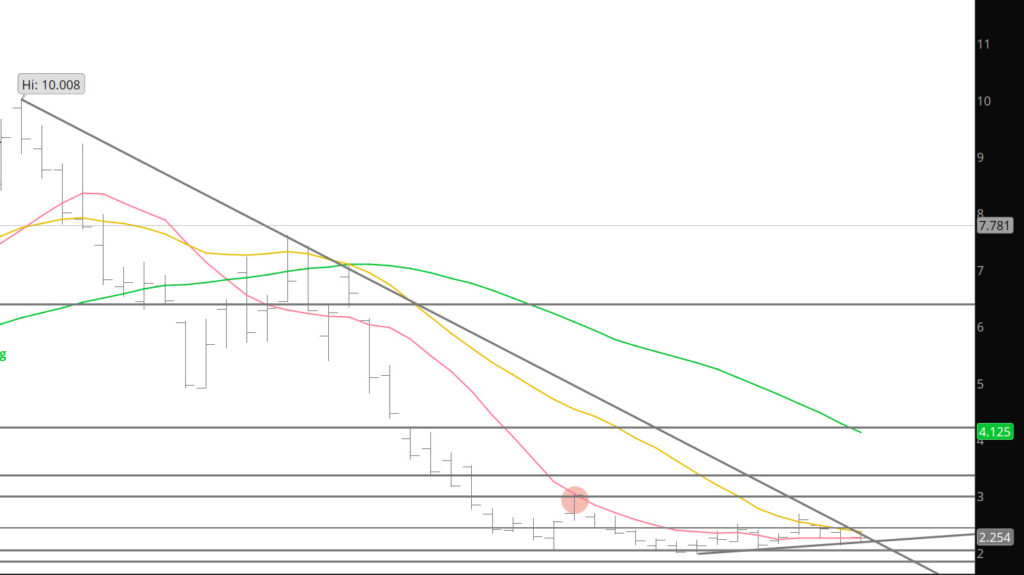
Per Weekly– Prices Run to Test Resistance
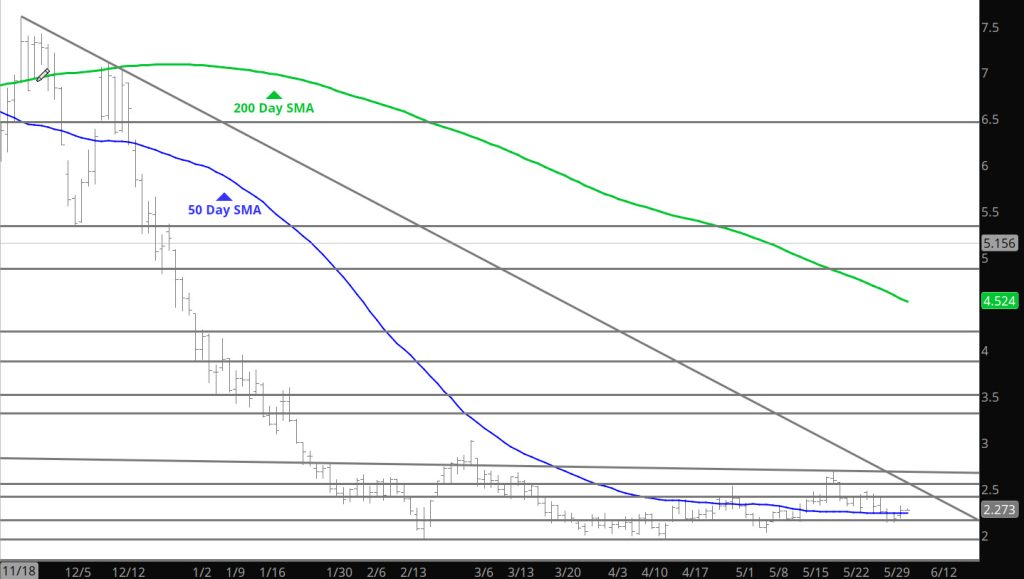
Mentioned in the Weekly section yesterday to expect a test of initial resistance at the $2.27 area and that happened quickly as the run climbed over $2.30. From there, prices came back to close the day just under the initial area. Would expect additional test as prices are heading into the historically bullish period for prices in July.
Major Support: $2.00, $1.991-$1.96, $1.795-$1.766
Minor Support: $
Major Resistance $2.543-$2.604, $2.836, $3.00, $3.536, 3.595
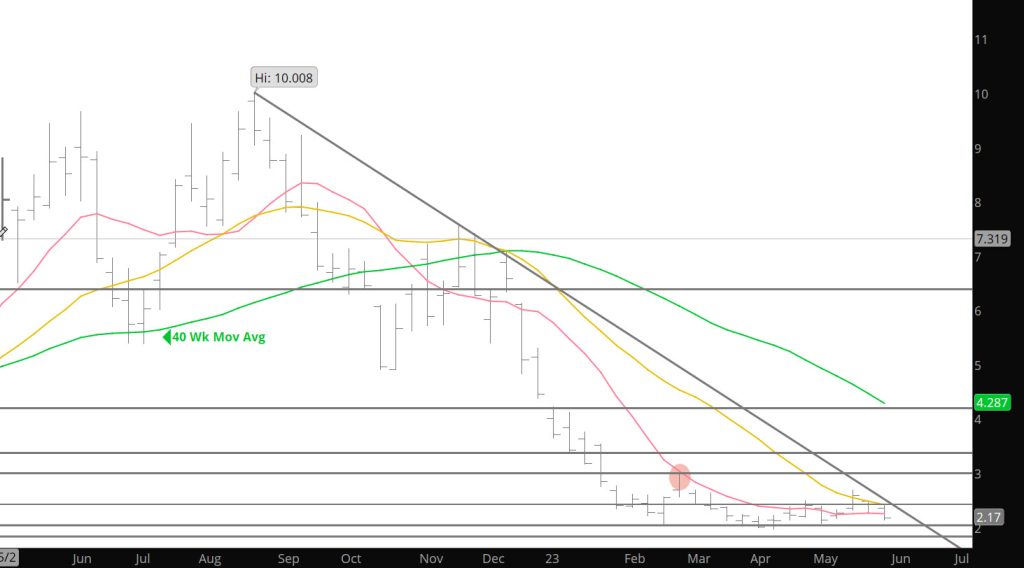
Declines Ran Out of Steam (For Now?)
To read The Daily Call you must be a subscriber (Current members sign in here. ) Start your subscription today.