To read The Daily Call you must be a subscriber (Current members sign in here. ) Start your subscription today.
Author: Willis Bennett
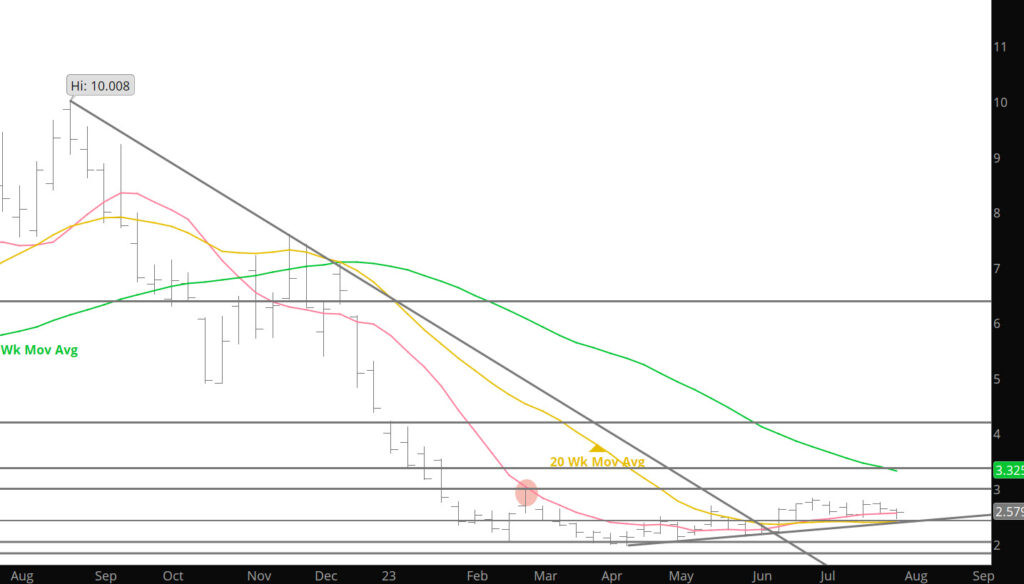
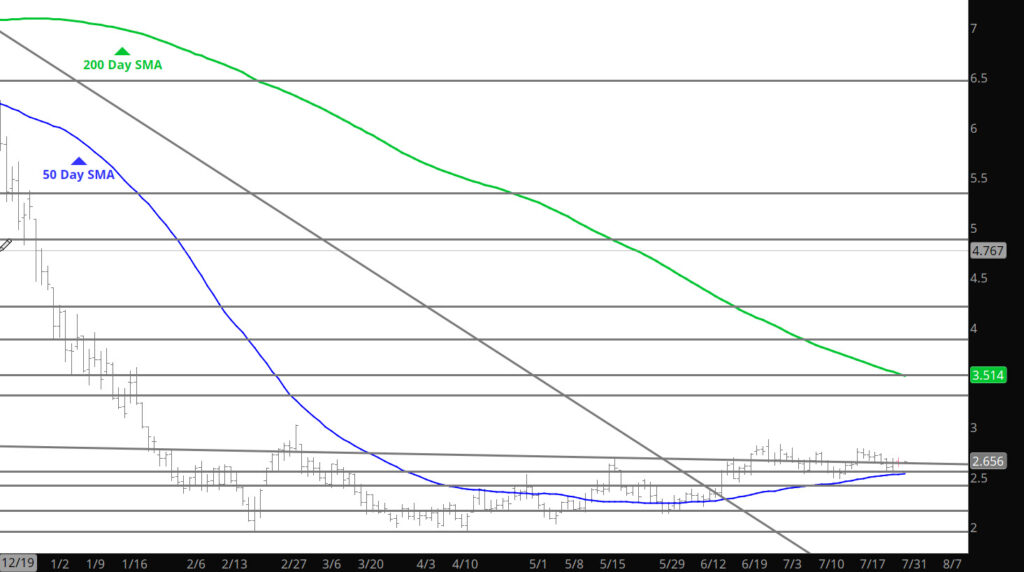
Breakout
Daily Continuous
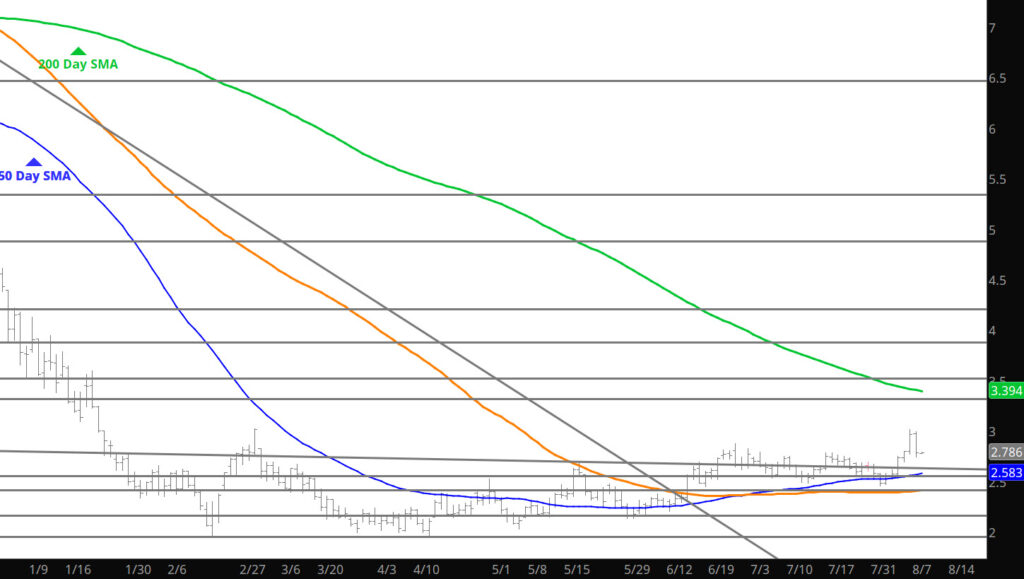
A little surprised that the break out to the highs from Feb occurred this early in the September prompt (was expecting it after Labor Day) but perhaps that timing will provide the next leg in the current run. Nevertheless, yesterday provided the proof of what has been suggested here for a couple of months – that a series of higher highs and higher lows, is signalling the gradual demise of the bear market in 2023. What is next — storage report will be interesting to watch what occurs after the gains of yesterday — but my expectation is a retracement of the gains during the trade and a test of support provided by the old range.
Major Support: $2.47, $2.00, $1.991-$1.96, $1.795-$1.766
Minor Support $2.836-$2.81, $2.38-$2.26, $2.17
Major Resistance $3.00, $3.536, 3.59
This Week It Is the High End
To read The Daily Call you must be a subscriber (Current members sign in here. ) Start your subscription today.
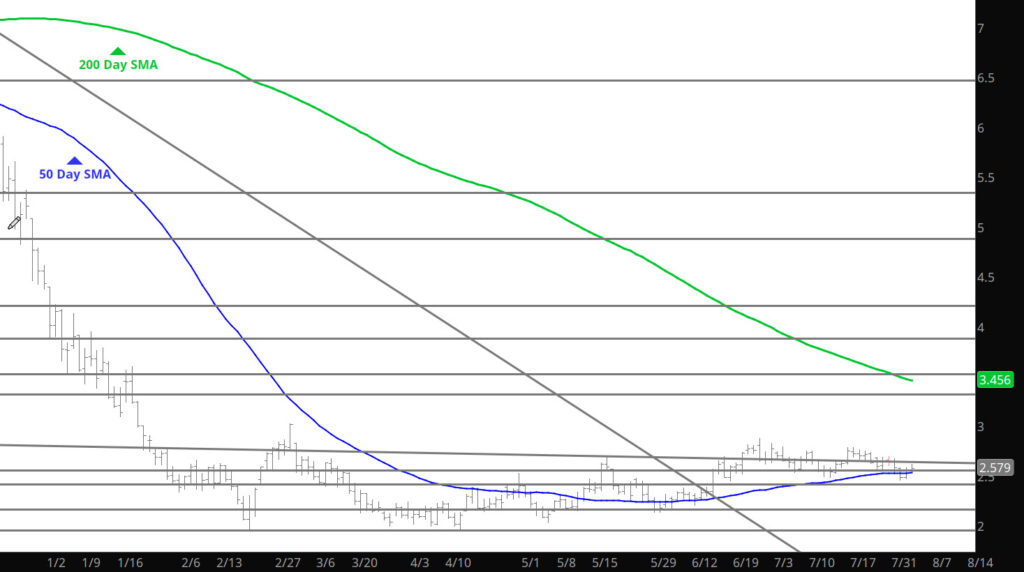
Price Action Decides to Challenge Resistance
To read The Daily Call you must be a subscriber (Current members sign in here. ) Start your subscription today.
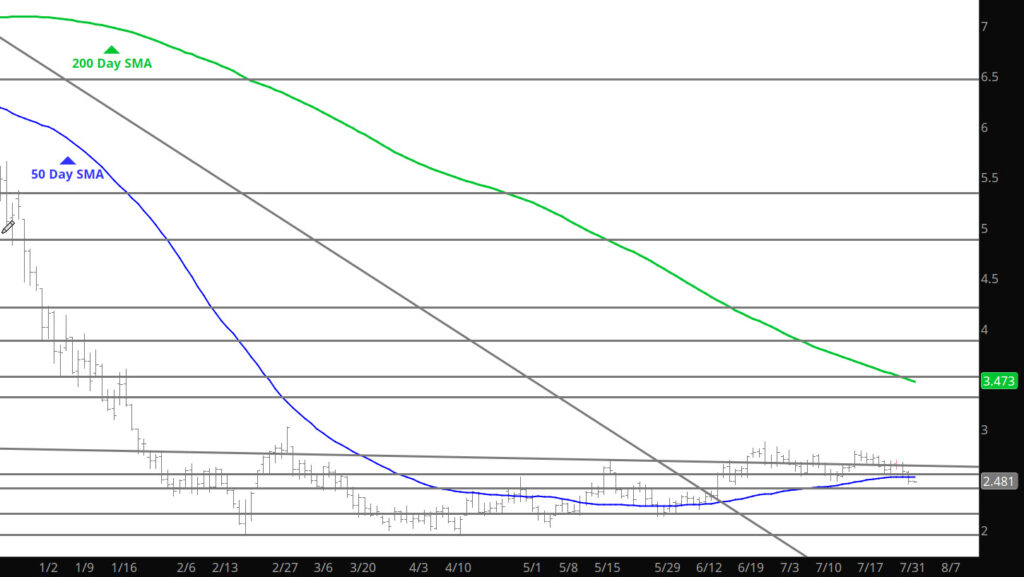
Near Term Support Holds
To read The Daily Call you must be a subscriber (Current members sign in here. ) Start your subscription today.
Range Continues to Hold
To read The Daily Call you must be a subscriber (Current members sign in here. ) Start your subscription today.
Trader Heaven

To read The Daily Call you must be a subscriber (Current members sign in here. ) Start your subscription today.
Tests and Closes the Day at Mid Term Support
To read The Daily Call you must be a subscriber (Current members sign in here. ) Start your subscription today.
Exciting — Isn’t it
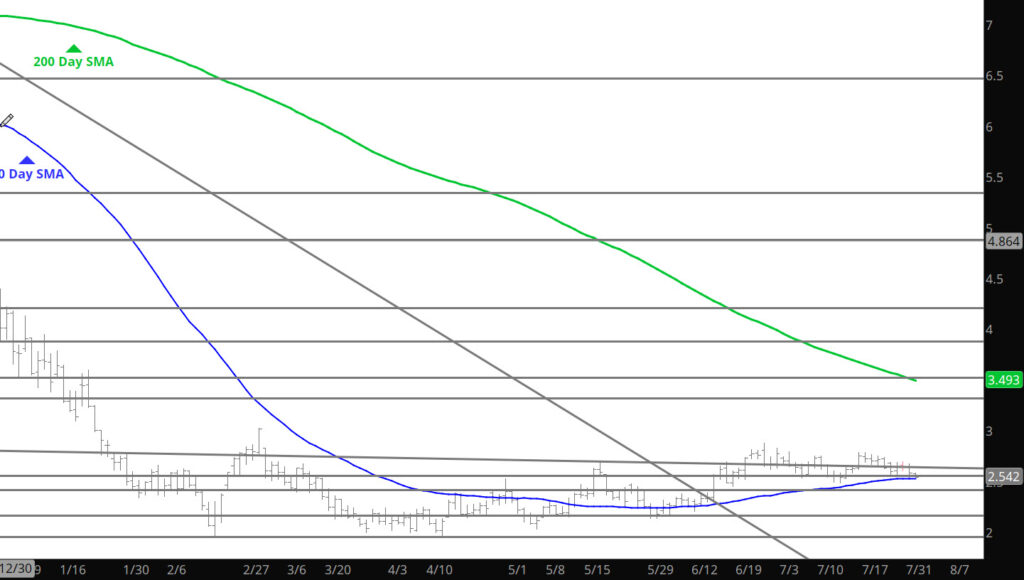
Daily Continuous
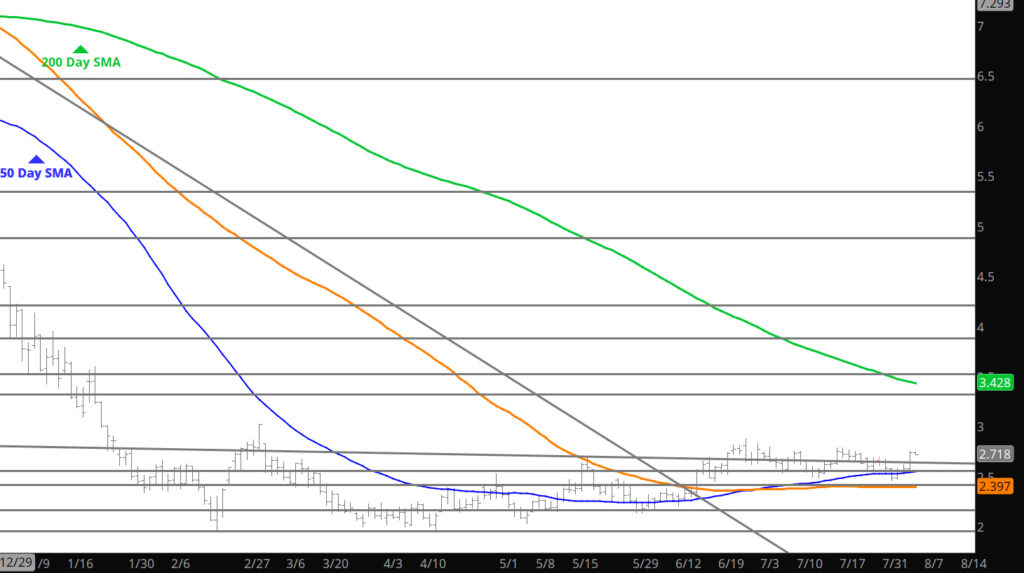
Does the concept of watching paint dry come into play here.
Major Support: $2.00, $1.991-$1.96, $1.795-$1.766
Minor Support:$2.52-$2.47, $2.38-$2.26, $2.17
Major Resistance $2.816-$2.836, $3.00, $3.536, 3.59
Going Nowhere at a Turtle Pace
To read The Daily Call you must be a subscriber (Current members sign in here. ) Start your subscription today.