To read The Daily Call you must be a subscriber (Current members sign in here. ) Start your subscription today.
Author: Willis Bennett
Working Hard For the Money
To read The Daily Call you must be a subscriber (Current members sign in here. ) Start your subscription today.
Different Contract Prompt – Similar Range
To read The Daily Call you must be a subscriber (Current members sign in here. ) Start your subscription today.
No Ceiling Break
To read The Daily Call you must be a subscriber (Current members sign in here. ) Start your subscription today.
Bumping Upon a Ceiling
To read The Daily Call you must be a subscriber (Current members sign in here. ) Start your subscription today.
Is Support Building For a Break
To read The Daily Call you must be a subscriber (Current members sign in here. ) Start your subscription today.
Oh Look — Consolidation Continues
To read The Daily Call you must be a subscriber (Current members sign in here. ) Start your subscription today.
Spring Trade Action Similar to 2020 and Last Year
To read The Daily Call you must be a subscriber (Current members sign in here. ) Start your subscription today.
Tired of Reading About Range Trade?
To read The Daily Call you must be a subscriber (Current members sign in here. ) Start your subscription today.
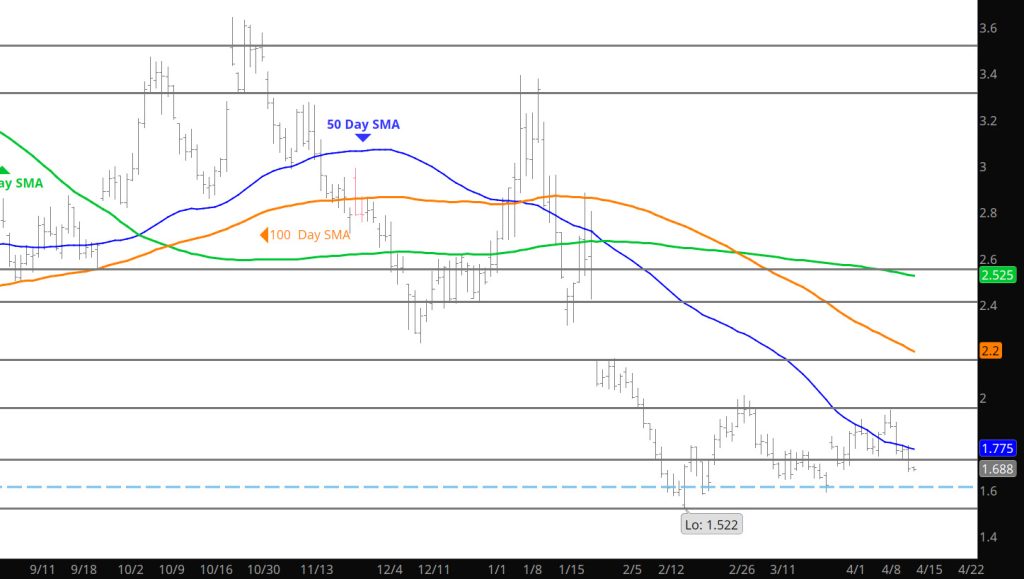
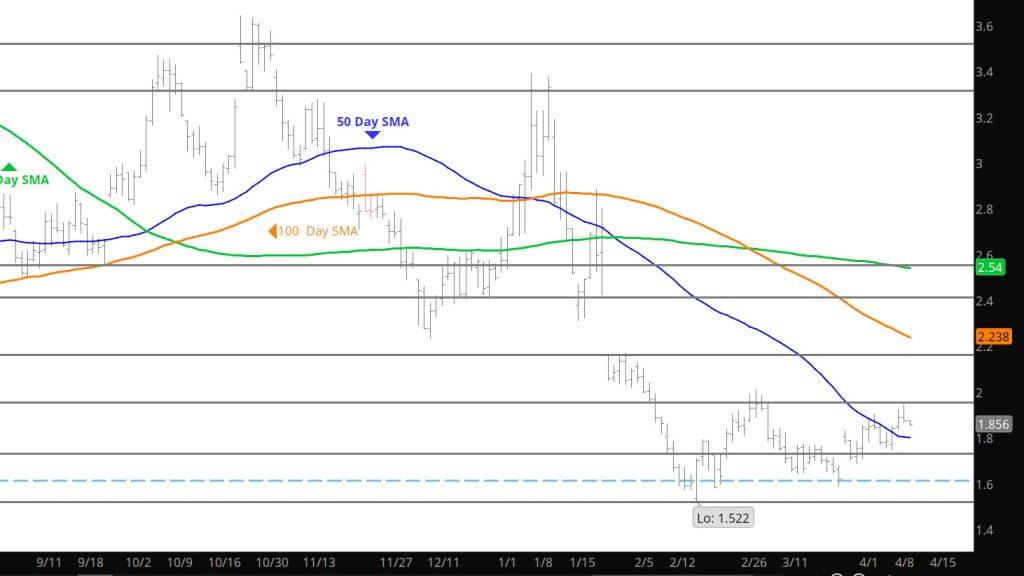
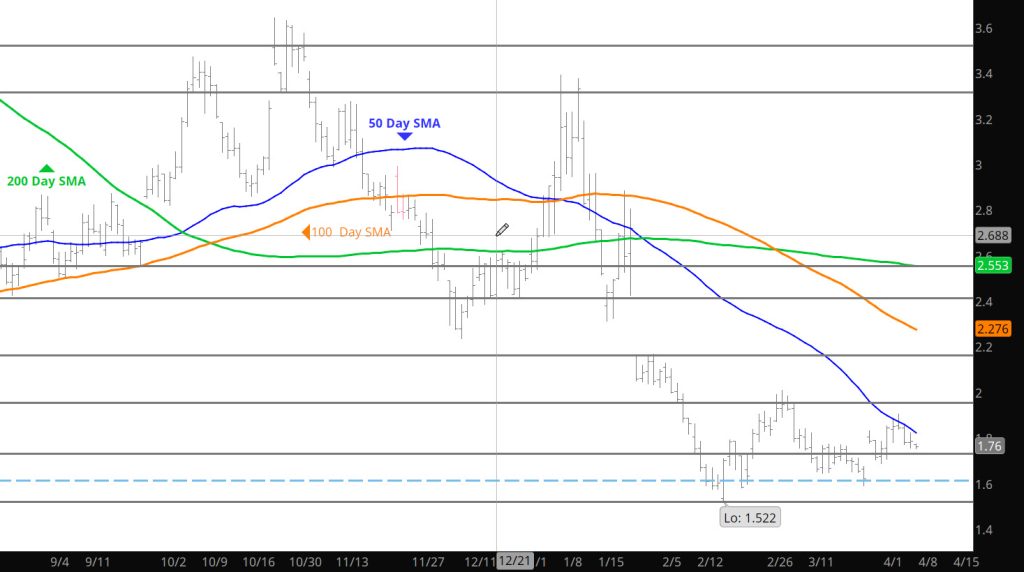
Resistance is “Resistance”
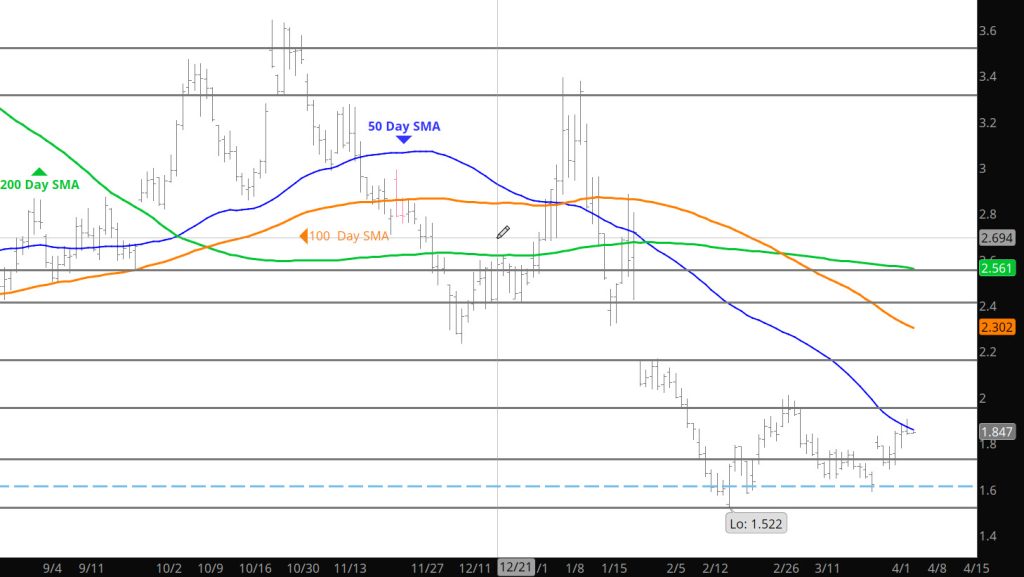
Daily Continuous
That is why they call it resistance as prices trade between the 50 Day SMA and the 10 Week SMA but does not close above them both on a daily basis. The trader has to believe resistance breaks or holds — your guess is as good as mine.
Major Support:, $1.595, $1.52-$1.519, $1.432, $1.312
Minor Support :
Major Resistance: $1.87, $1.94-$1.967, $2.00, $3.00, $3.16, $3.48, $3.536, 3.59,