To read The Daily Call you must be a subscriber (Current members sign in here. ) Start your subscription today.
Author: Willis Bennett
Breakout Excitement
To read The Daily Call you must be a subscriber (Current members sign in here. ) Start your subscription today.
Similar Drift Upward to Last Week
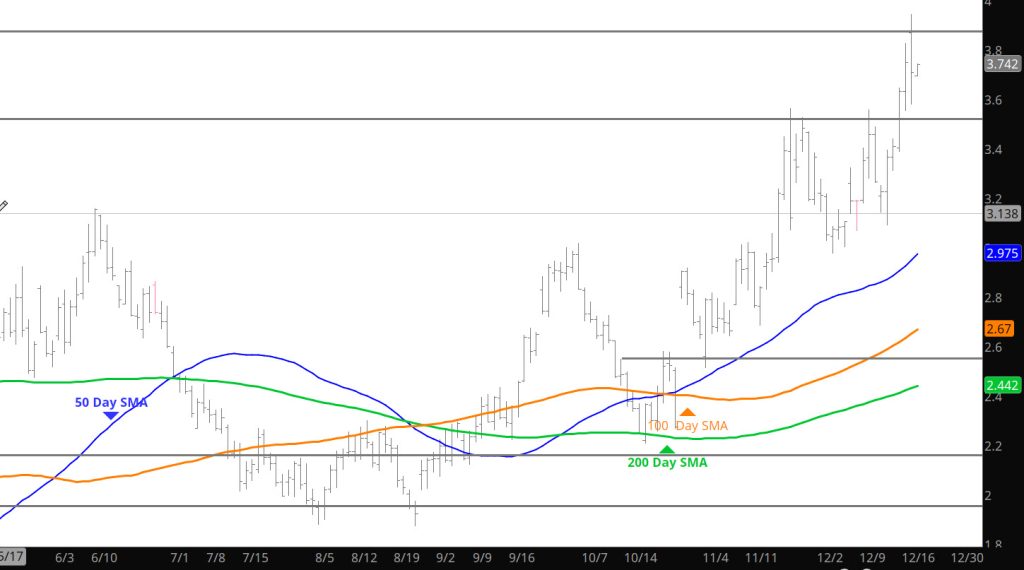
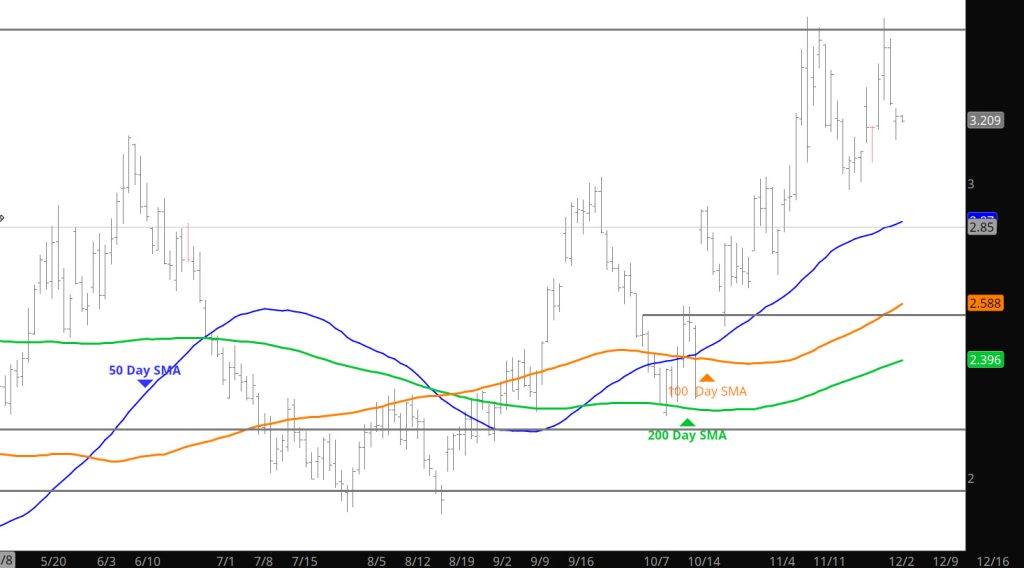
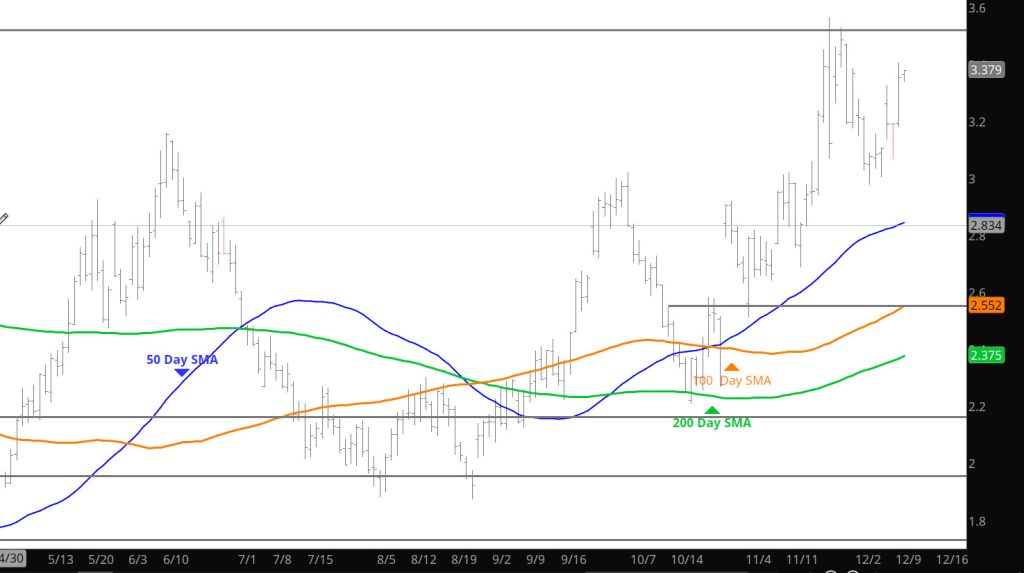
Daily Continuous
Similar trade behavior to last week with the early week weakness followed by a small rally into the storage release. Last week the Thursday rally set the high for the week before melting back into the range on Friday. Have to wait and see how this report effects price action but from the trading standpoint you have to continue trading the range.
Major Support:,$2.727-$2.784, $2.648, $2.39, $2.35, $2.112,
Minor Support : $3.167, $3.00-$2.95, $2.914, $1.856,$1.89-$1.856
Major Resistance: $3.307 $3.392, $3.487, $3.527–$3.563
Whip-saw Confusion
To read The Daily Call you must be a subscriber (Current members sign in here. ) Start your subscription today.
Declines Run Low on Volume
To read The Daily Call you must be a subscriber (Current members sign in here. ) Start your subscription today.
Prices Testing Lower Range
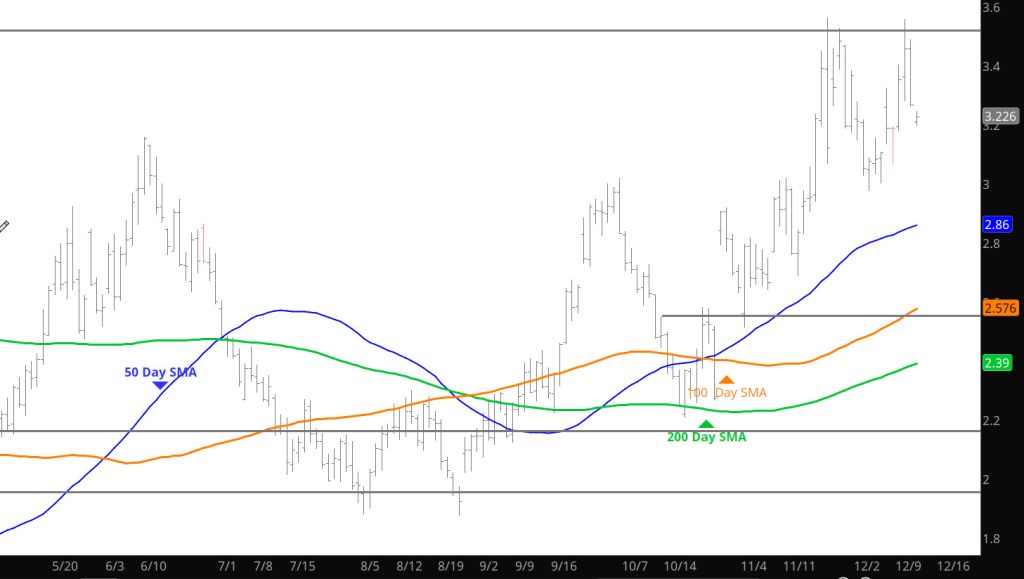
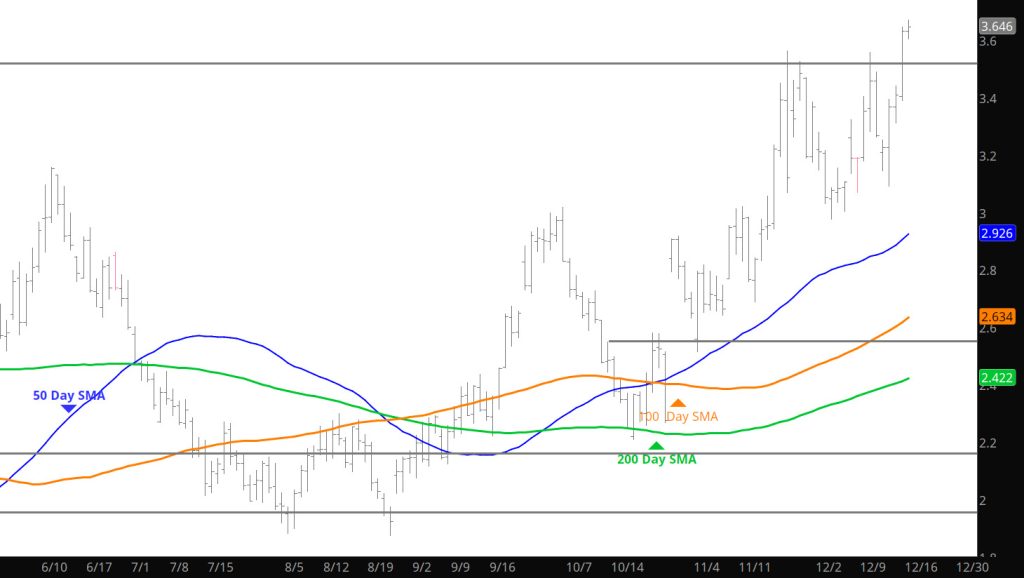
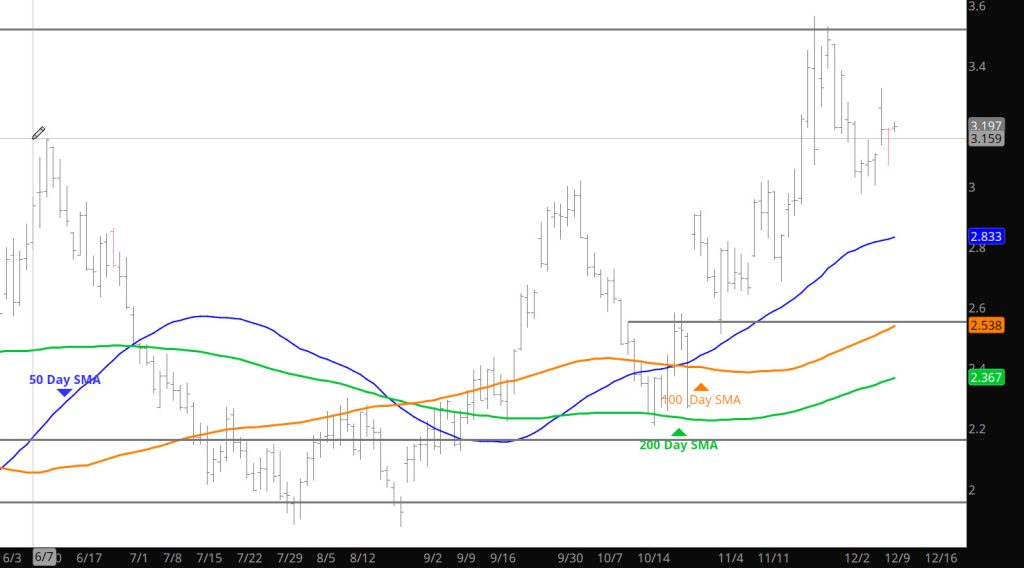
Daily Continuous
Go into the expectations in the Weekly section bu suffice to say, that prices are likely to continue in the recent range that was discussed last week but mentioned again in the Weekly. Prices are starting the Sunday trade lower — so expect a decline lower to the Support zone.
Major Support:,$2.727-$2.784, $2.648, $2.39, $2.35, $2.112,
Minor Support : $3.167, $3.00-$2.95, $2.914, $1.856,$1.89-$1.856
Major Resistance: $3.307 $3.392, $3.487, $3.527–$3.563
Lack of Commitment
To read The Daily Call you must be a subscriber (Current members sign in here. ) Start your subscription today.
Storage Release Brings Bulls Out
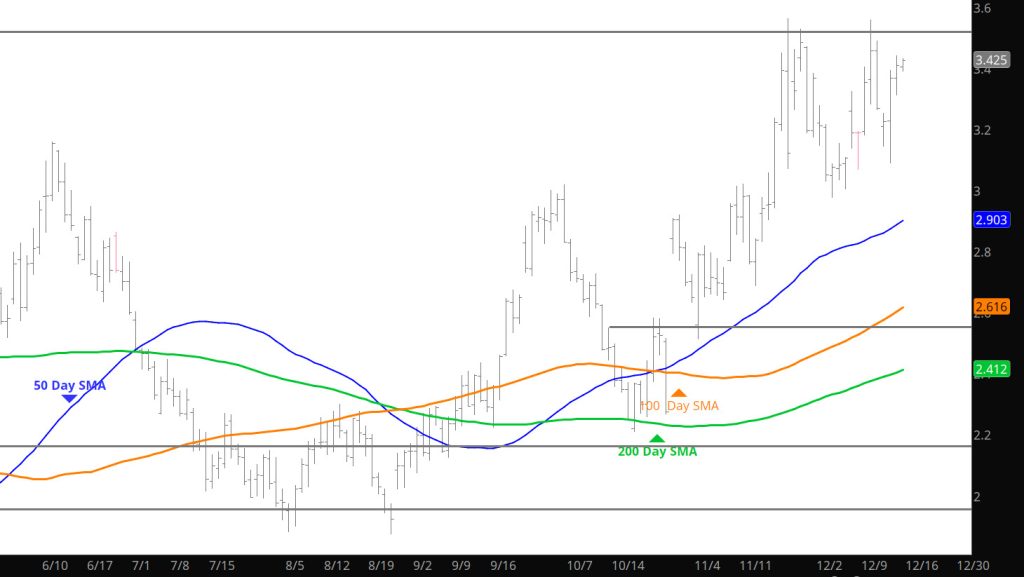
Daily Continuous
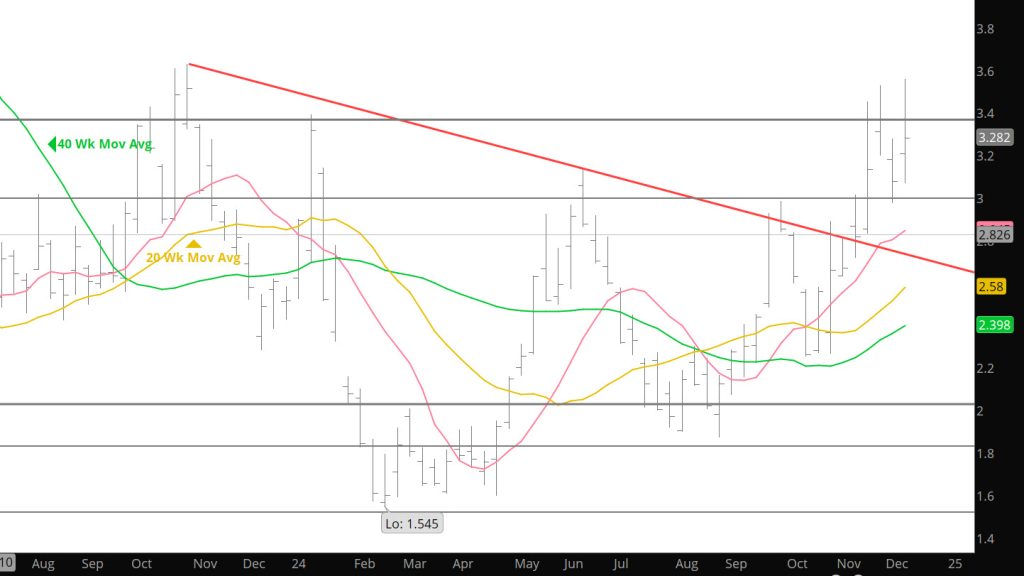
Not sure that the bullish storage release changes perceptions but it is clear that the withdrawal caught a few off guard. Not sure if it was short covering as the CFTC report does not come out until Friday and the open interest data is delayed be one day. Look for confirmation from the trade today and on the open on Monday for a longer term bullish bias.
Major Support:,$2.727-$2.784, $2.648, $2.39, $2.35, $2.112,
Minor Support : $3.167, $3.00-$2.95, $2.914, $1.856,$1.89-$1.856
Major Resistance: $3.307 $3.392, $3.487, $3.527–$3.563
Trying To Test Resistance
To read The Daily Call you must be a subscriber (Current members sign in here. ) Start your subscription today.
What Can Be Said — Consolidation
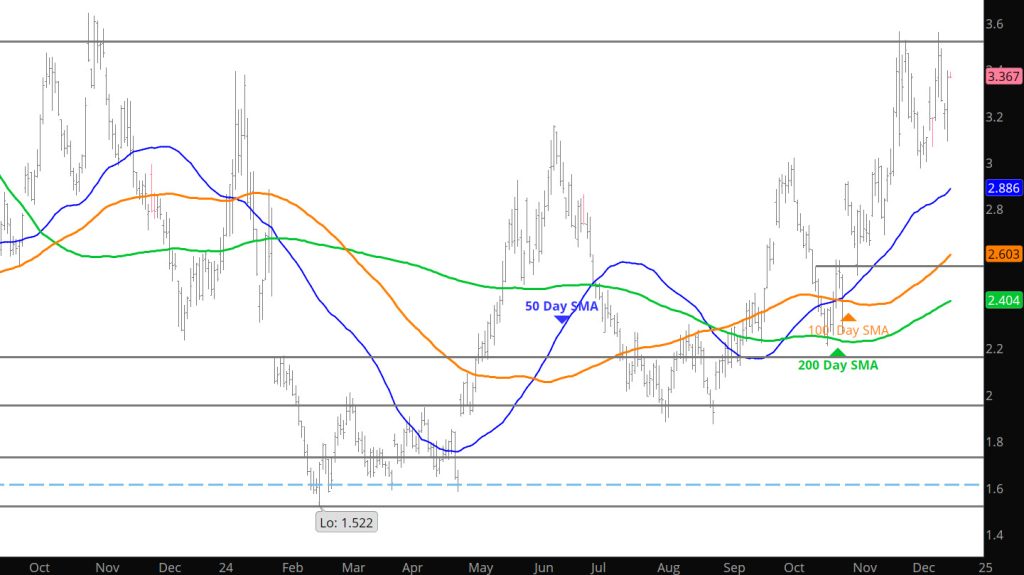
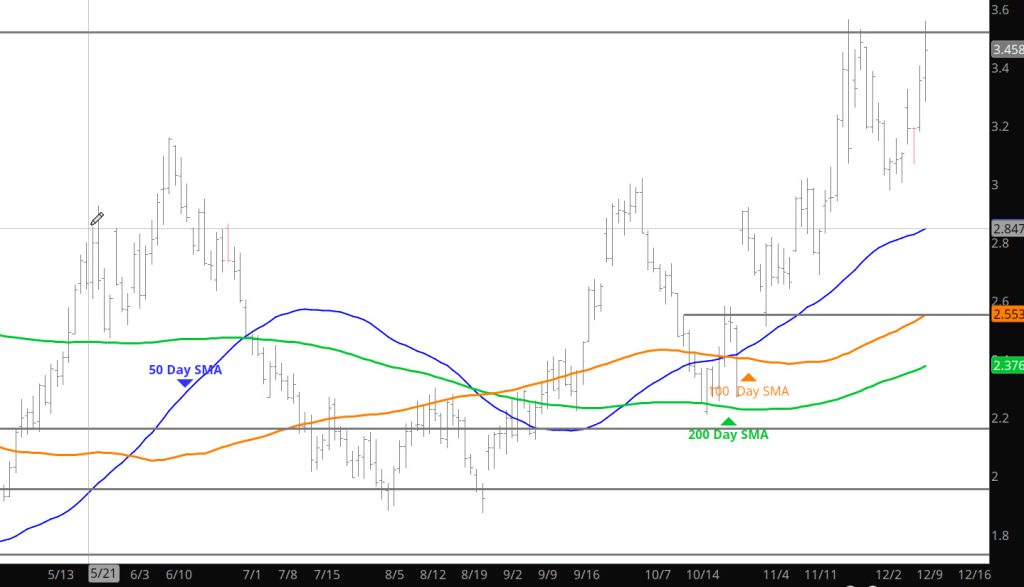
Daily Continuous
Prices semi tested the low side and now it looks to want to test the resistance area of the range. We’re just going to have to be patient here as price choose the bias.
Major Support:,$2.727-$2.784, $2.648, $2.39, $2.35, $2.112,
Minor Support : $3.00-$2.95, $2.914, $1.856,$1.89-$1.856
Major Resistance: $3.16, $3.307 $3.392, $3.487