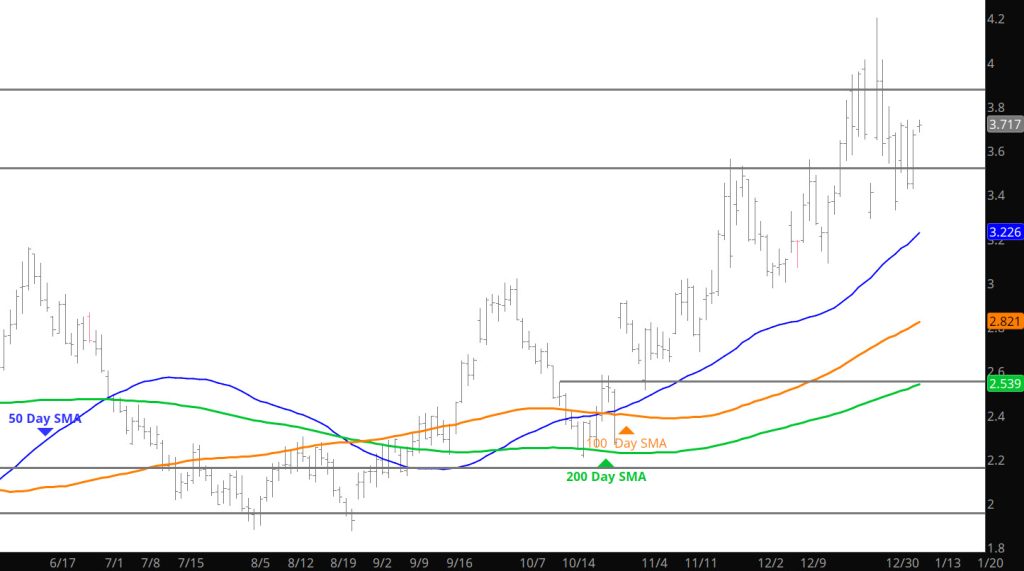
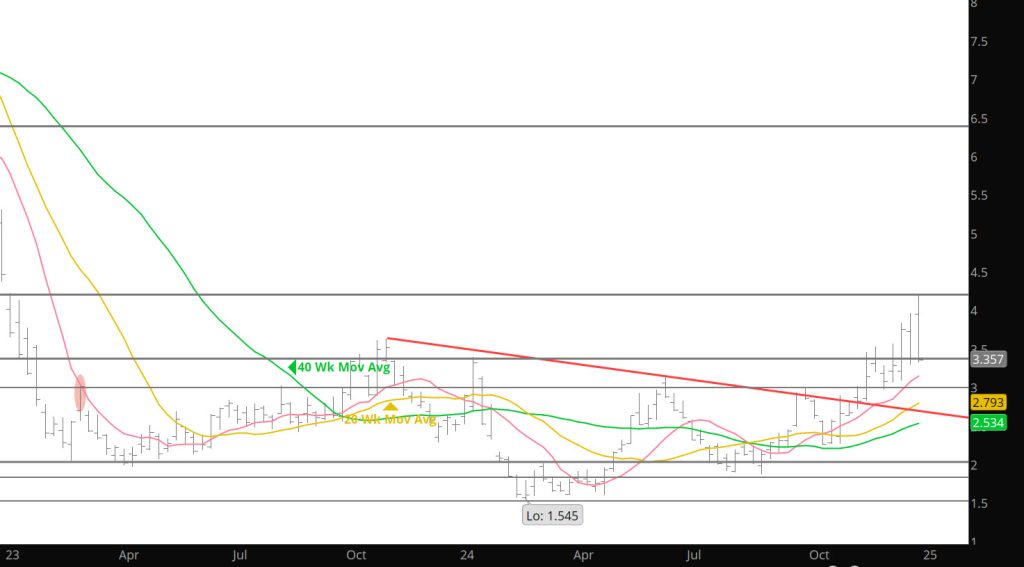
Compared to some of the recent trade days this year, yesterday have a “calm” day in terms of volatility. Perhaps is is just a set up for the storage data release or think of any thing else you want to. After last week’s reversal off of the high — I am going to stick with the bearish perspective from a general bias perspective — but will take advantage of any volatility that comes my way
Major Support:,$2.727-$2.784, $2.648, $2.39, $2.35, $2.112, Minor Support : $3.39-$3.31, $3.167, $3.00-$2.95, $2.914, $1.856,$1.89-$1.856 Major Resistance: $3.631-$3.681, $3.829, $3.92, $4.00, $4.20
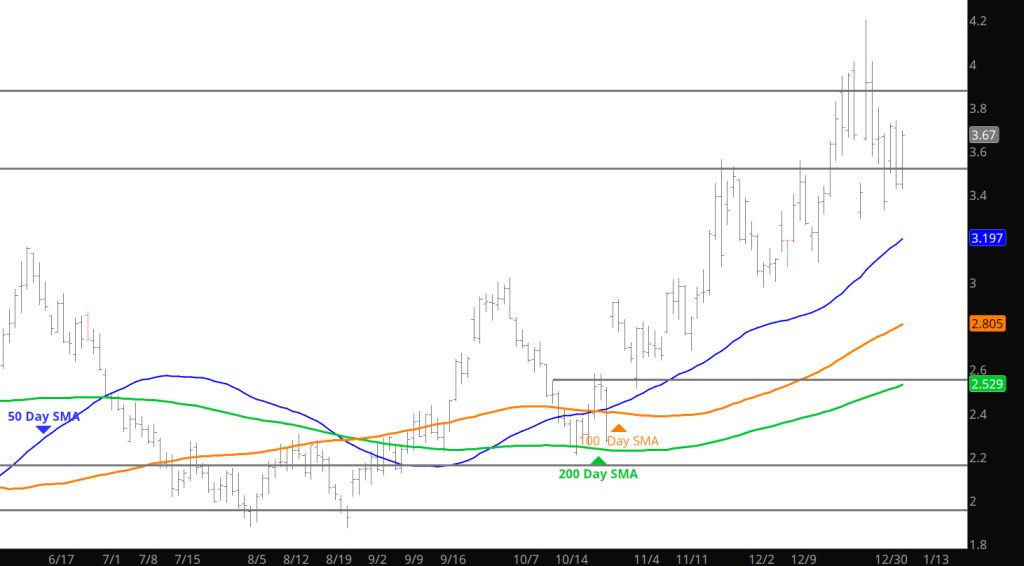
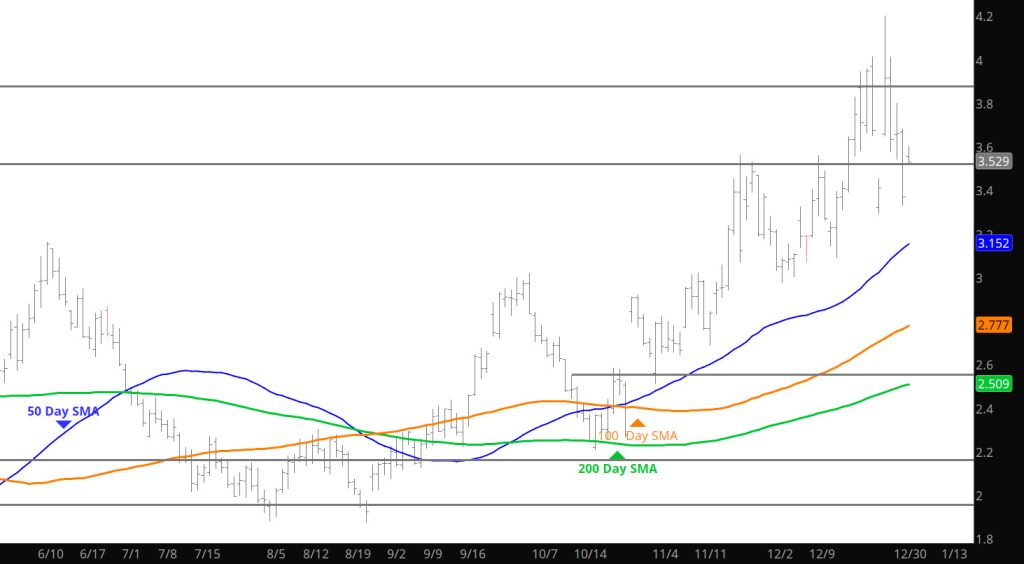
Similar intra-day trade behavior as Monday– prices started strong only to give up the gains as the day went on. Today is the set up for the storage release so I would doubt anything volatile happens. That being said — it seems that any change in the weather forecasts bring out the volatility.
Major Support:,$2.727-$2.784, $2.648, $2.39, $2.35, $2.112, Minor Support : $3.39-$3.31, $3.167, $3.00-$2.95, $2.914, $1.856,$1.89-$1.856 Major Resistance: $3.631-$3.681, $3.829, $3.92, $4.00, $4.20
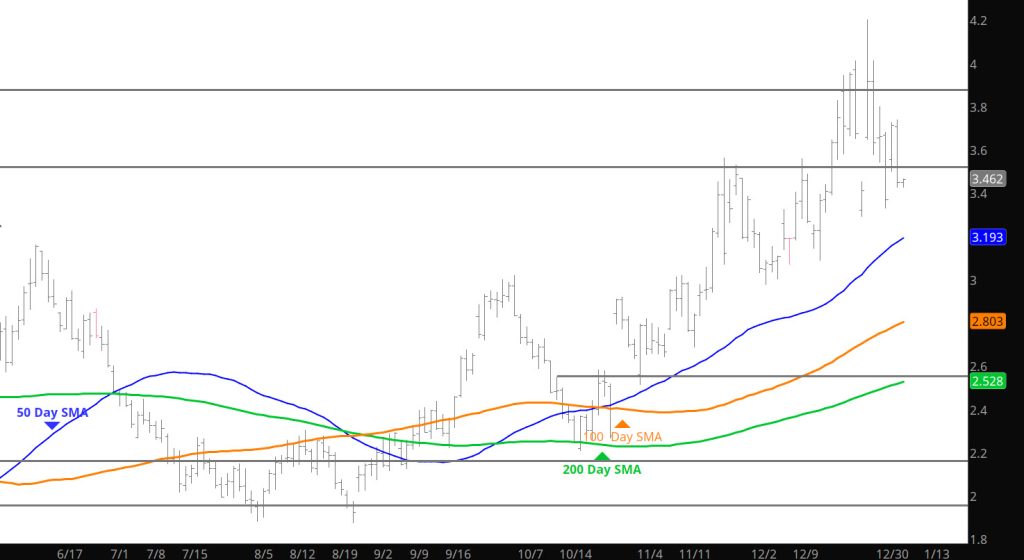
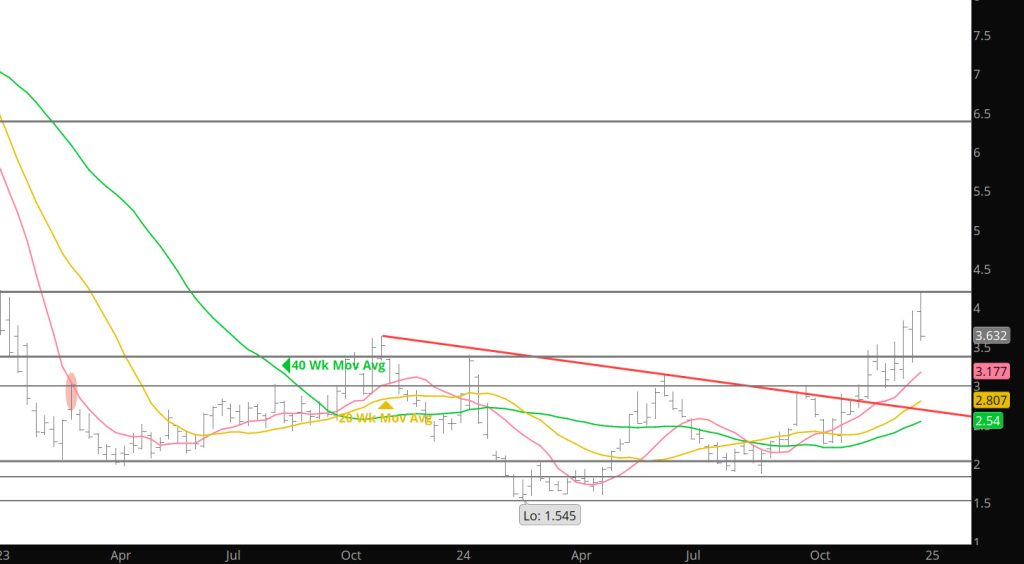
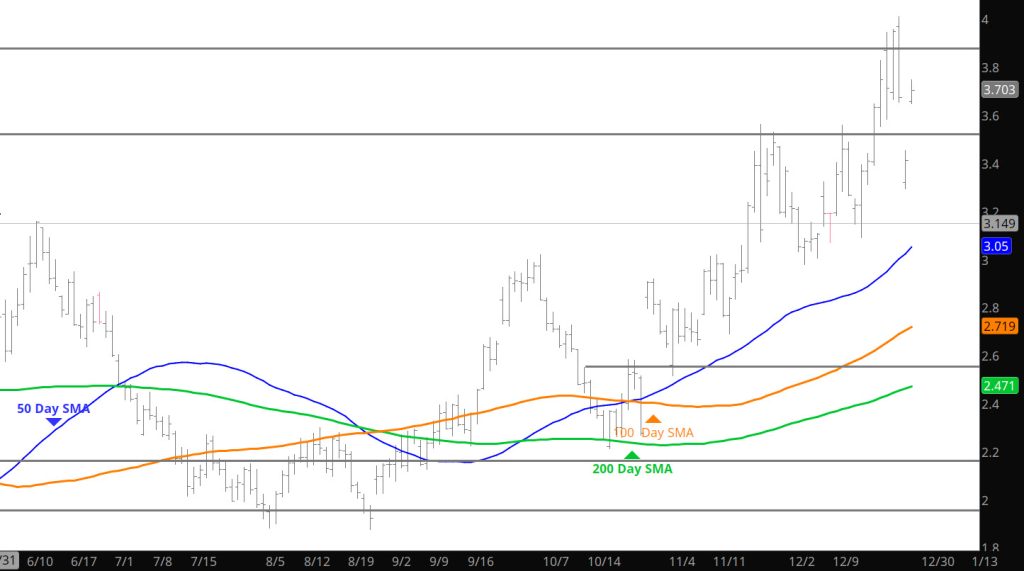
As suggested yesterday, that the January range has been developed with the exception of support. Granted, the lows from last week are the first target but that should be tested before the end of the month. The highs, discussed in the Weekly, will likely present resistance.
Major Support:,$2.727-$2.784, $2.648, $2.39, $2.35, $2.112, Minor Support : $3.39-$3.31, $3.167, $3.00-$2.95, $2.914, $1.856,$1.89-$1.856 Major Resistance: $3.631-$3.681, $3.829, $3.92, $4.00, $4.20
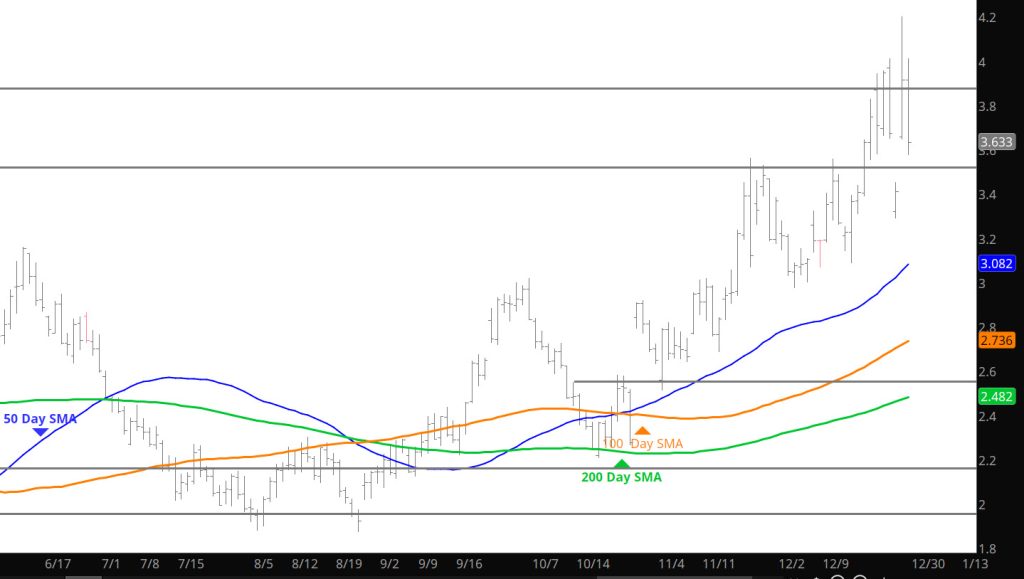
During the week ending 12/20 January broke out after a volatile consolidation period that followed the November high test of the upper boundary of a trading range that had confined successive prompts for nearly two years. The prompt closed at $3.748, the highest price since week ending 01/03/23. Price was higher but volume wasn’t (that sends a red flag to some technical analysts) to cast a skeptical eye. Over the entire 34 years history of natural gas trading there had never been an “inside” December (where for the entire month of December prompt gas remained between the price extremes traded during calendar November) and needless to say, there still has not been.
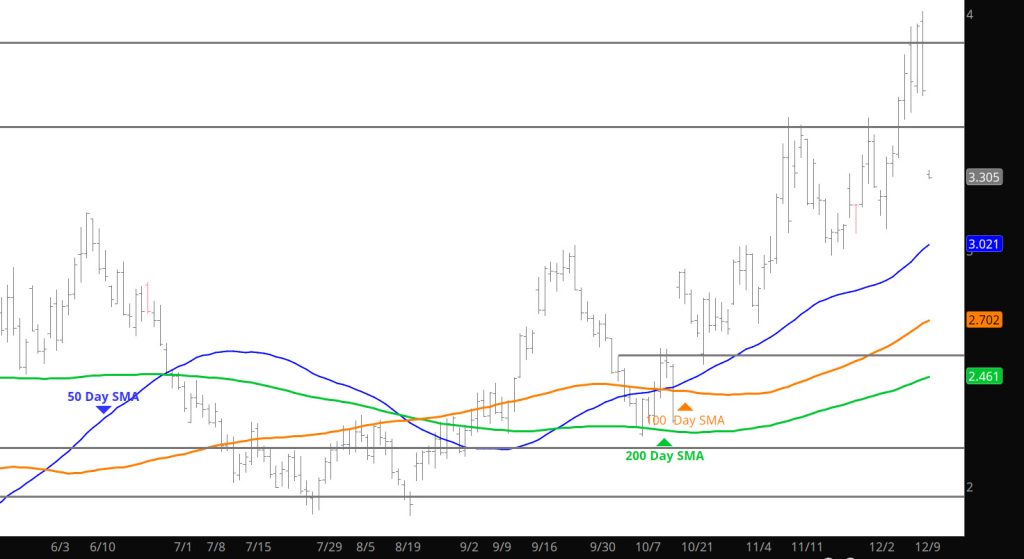
During week ending 12/27 January extended its price spike to $4.01 (the first trade to/through $4 since 01/09/23) before fading to go off the board at $3.644 (the highest monthly settlement since January ’23 at $4.709). February wasted little time before extending the rally to $4.201 with nearly a million shares changing hands on its first day as prompt but did not end the day (12/30) with a higher daily close than 12/24 another in a series of momentum divergences (a higher high (daily and weekly) without a higher close.
Last week’s reversal provided several divergences that put a cap on effects of any further upward run in prices. Discuss those divergences in the Weekly area. Suffice to say there are some significant selling zones above the weekly close. Not saying that price action can’t get back up to $4 and above- but will have to find significant buyers at several times.
Major Support:,$2.727-$2.784, $2.648, $2.39, $2.35, $2.112, Minor Support : $3.39-$3.31, $3.167, $3.00-$2.95, $2.914, $1.856,$1.89-$1.856 Major Resistance: $3.631-$3.681, $3.829, $3.92, $4.00
I mentioned in the Daily last week that I was going to quote a wonderful historical analyst (Larry Marshall) who has been following the gas market as long as I have. Here are some of the highlights of his thoughts……
Sometime in the late ‘90s I noticed a tendency of consistent price change at the beginning of each calendar year…almost without exception. Because of the consistency of the tendency and disproportional importance relative to the other eleven calendar months I came to call it the January Phenomenon. Each year about this time I write a summary of those year ending/beginning events…the following is not a lot different than more than twenty – five or so (I lose count) that preceded it.
Almost since the beginning of recorded time (which in natural gas trading for convenience begins in December ’91 – January ’92), late December/early January highs or lows have consistently been more significant going forward into each New Year than the endings/beginnings of other calendar months.
To summarize the 33 years ending since 1991 – 92:
Twenty three of the thirty – three have begun with a gap (although a couple of times the gap occurred during the last or next to last trading day of December).
At the end of ‘23/beginning of ’24 there were two gaps. The first, on 12/28 was an expiration gap…February was offered at a discount to January ($2.536 v $2.621). The second was on the first trading day of the year. Both were quickly closed.
Eight times (five of which began with a gap) the high of the year traded during January, most often during the first week.
Seven times (five of which began with a gap) the low of the year traded during January, most often during the first week.
In the other seventeen years (now 18), thirteen of which began with a gap, either the high of low for January (and in several cases neither) would not be violated for a period of months but once either was, it was consequential…setting the direction of gas prices for an extended period.
The January ’23 low traded on 01/31 at $2.037. That low was violated on 02/01. Prompt gas traded lower until late March, falling another 27%.
During the six years beginning in ’18 and ending in ’23, the January low was the low of the year twice (’21 and ’22). The January high was the high in ’19. In 2018 the January high was not exceeded until November, in ’20 during August. During ’23 the January high…$3.392 traded on 01/09 (the sixth trading day of the year) was not exceeded until November 21st. Prompt gas has closed above that high twice, the last time was 12/12 at $3.455…the highest daily close since 11/03/23.
All things considered, 2024 conformed pretty closely to the expectation flowing from the January Phenomenon. We are not sure what the 2025 January Phenomenon will provide but I do find it interesting that a gap has already traded on the 27th (last Monday) meeting the historical norm. That gap remains open and should be considered as support.
Major Support:,$2.727-$2.784, $2.648, $2.39, $2.35, $2.112, Minor Support : $3.39-$3.31, $3.167, $3.00-$2.95, $2.914, $1.856,$1.89-$1.856 Major Resistance: $3.631-$3.681, $3.829, $3.92, $4.00
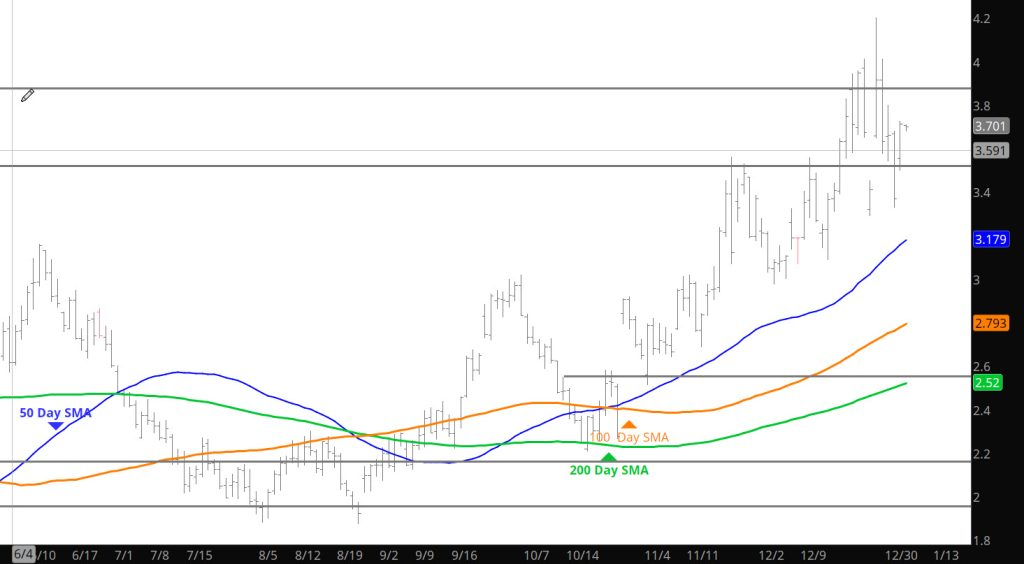
Early trade this week has provides important historical perspective (please read the historical analysis in the Weekly section). At the close on New Year’s Eve prices had retreated to the range that has held the action for the last few months. Continue to trade the range — been profitable so far.
Major Support:,$2.727-$2.784, $2.648, $2.39, $2.35, $2.112, Minor Support : $3.39-$3.31, $3.167, $3.00-$2.95, $2.914, $1.856,$1.89-$1.856 Major Resistance: $3.631-$3.681, $3.829, $3.92, $4.00
First off the Daily will be spotty this week with the New Year’s and my travel. The Weekly will be available on Dec 31st and it will have an interesting historical tendency for prices in early Jan, that posting may well be the last of next week. In the mean time, the action on Sunday night took the Feb back up to the range of Jan. Not sure if that will hold during the trade on Monday after more participants join the party. As suggested during the expiration- play the ranges until a defined bias is created on normal volume.
Major Support:,$2.727-$2.784, $2.648, $2.39, $2.35, $2.112, Minor Support : $3.39-$3.31, $3.167, $3.00-$2.95, $2.914, $1.856,$1.89-$1.856 Major Resistance: $3.631-$3.681, $3.829, $3.92, $4.00
Price action got slapped coming out of the pre-holiday run and returned $.25 yesterday. Now we head into expiration and there is a significant discount of the Jan contract to the Feb. While figuring out how that is going to work out, traders get a storage release to evaluate, Some traders use the options market if they have to have a position on. I am expecting some declines in the Jan contract going into expiration and for Feb to hang tight.
Major Support:,$2.727-$2.784, $2.648, $2.39, $2.35, $2.112, Minor Support : $3.39-$3.31, $3.167, $3.00-$2.95, $2.914, $1.856,$1.89-$1.856 Major Resistance: $3.631-$3.681, $3.829, $3.92, $4.00