To read The Daily Call you must be a subscriber (Current members sign in here. ) Start your subscription today.
Author: Willis Bennett
Bouncing Between
Daily Continuous
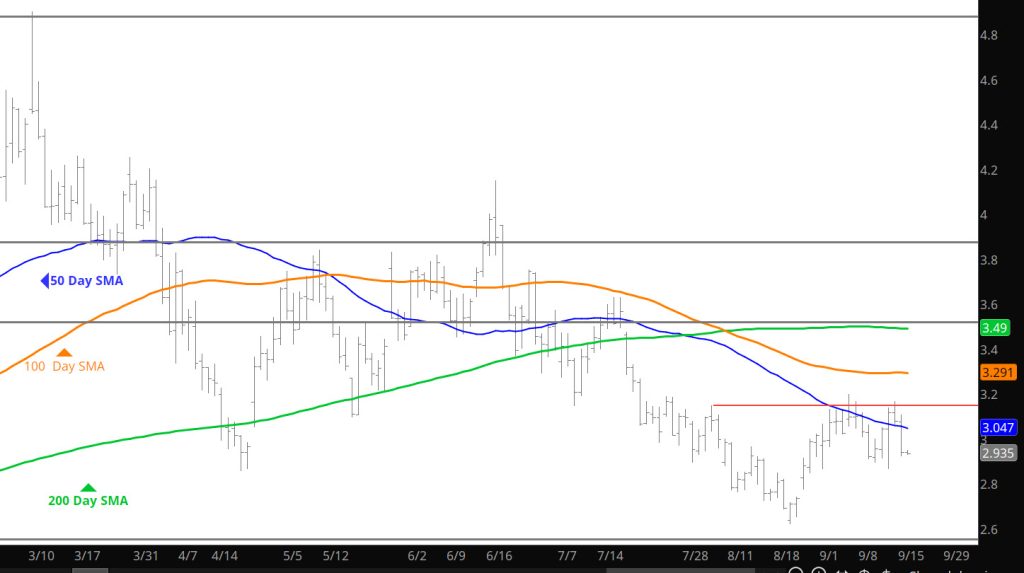
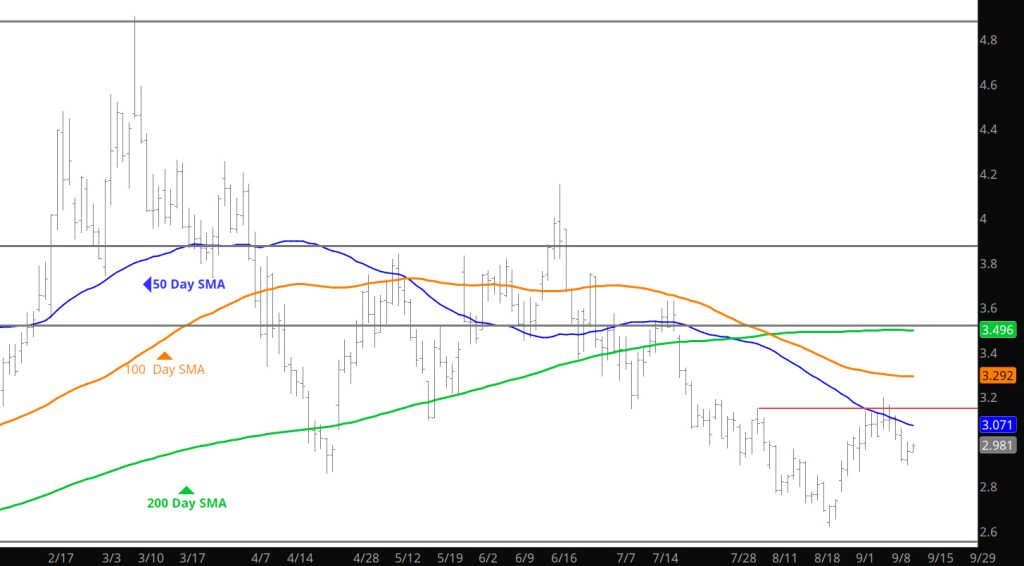
Price action bounced within the range that has developed – watch to see how the market responds to the storage action coming.
Major Support: $3.00-$2.97, $2.843, $2.727, $2.648
Minor Support :
Major Resistance: $3.061, $3.16, $3.192, $3.25-$3.31,$3.39, $3.62, $4.168, $4.461,
Bizarre Trade Become Strength
Daily Continuation
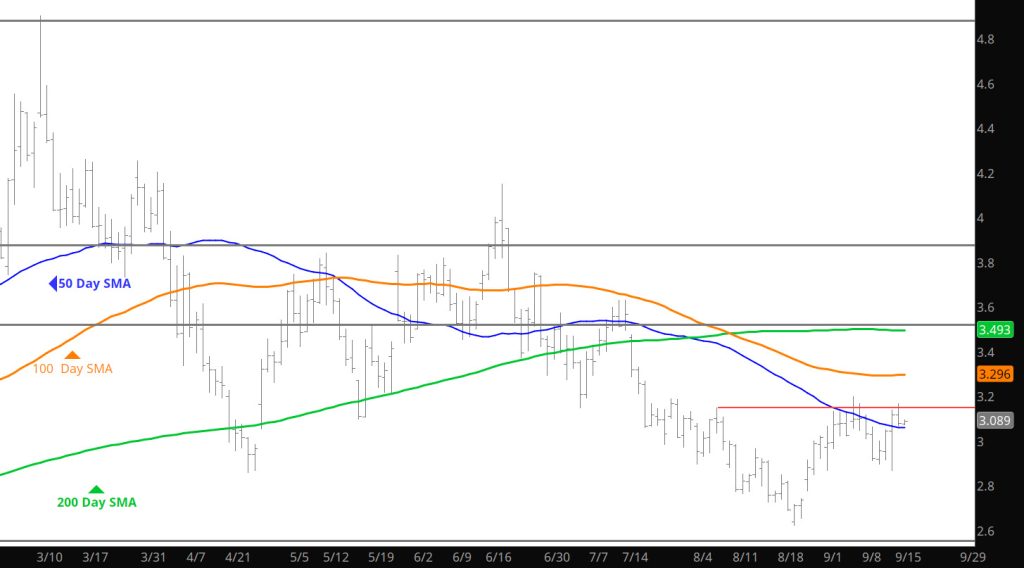
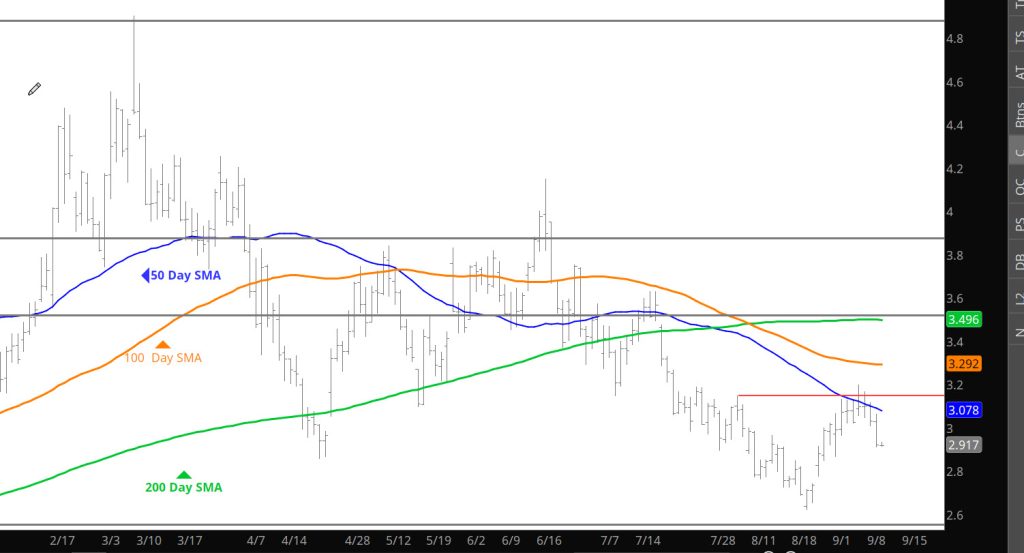
Mentioned that action in the after market trade yesterday, but it turned out a useless indicator for future prices as the market continued to gain. Now approaching the earlier month highs for the price range– but should be continued as resistance for near term trade.
Major Support: $3.00-$2.97, $2.843, $2.727, $2.648
Minor Support :
Major Resistance: $3.061, $3.16, $3.192, $3.25-$3.31,$3.39, $3.62, $4.168, $4.461,
Weird Action
To read The Daily Call you must be a subscriber (Current members sign in here. ) Start your subscription today.
Another Range Bound Monthly Trade
To read The Daily Call you must be a subscriber (Current members sign in here. ) Start your subscription today.
Negative Bias Reinforced
To read The Daily Call you must be a subscriber (Current members sign in here. ) Start your subscription today.
Storage Report Breaks Down Prices
Daily Continuous
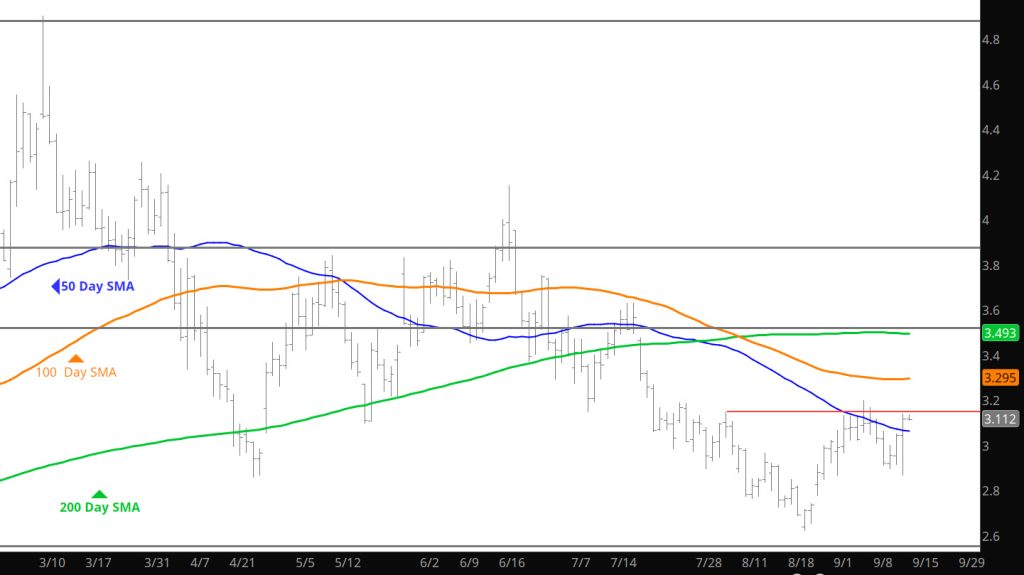
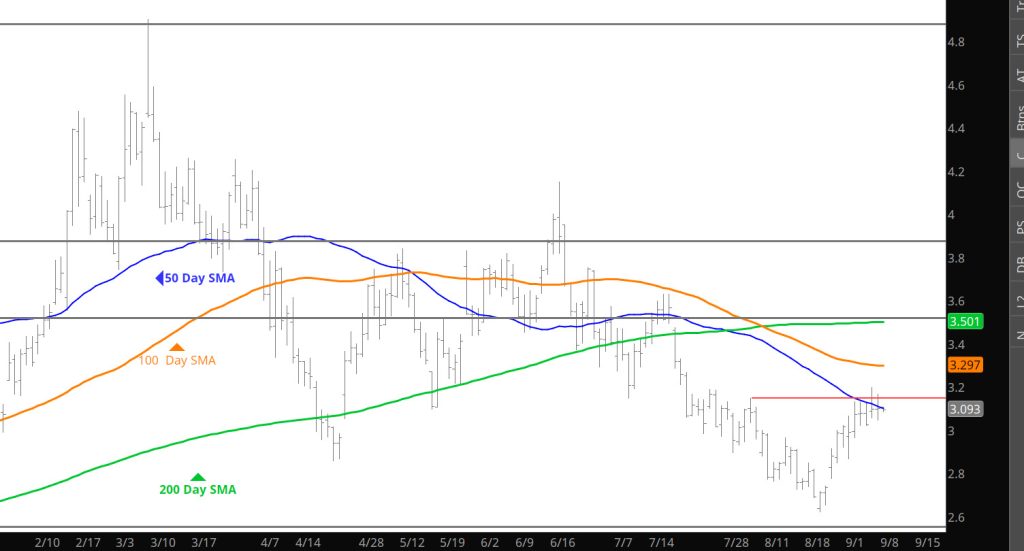
The release of the storage data was more of an injection than expected but doesn’t have any sort of dramatic impact on prices through the winter (watch the prompt relationship to Jan’26) in the near term. That is where you will see any concerns about gas this winter to October.
Major Support: $3.00-$2.97, $2.843, $2.727, $2.648
Minor Support :
Major Resistance: $3.061, $3.16, $3.192, $3.25-$3.31,$3.39, $3.62, $4.168, $4.461,
Initial Resistance Holds
Daily Continuous
Not sure if there will be more volatility today as prices and volume seemed wired in a tight range. Stick to selling premium in this type of environment.
Major Support: $3.00-$2.97, $2.843, $2.727, $2.648
Minor Support :
Major Resistance: $3.061, $3.16, $3.192, $3.25-$3.31,$3.39, $3.62, $4.168, $4.461,
Resistance Tested
To read The Daily Call you must be a subscriber (Current members sign in here. ) Start your subscription today.
Similar to Recent Months Trade Begins Defining Range
Weekly Continuous
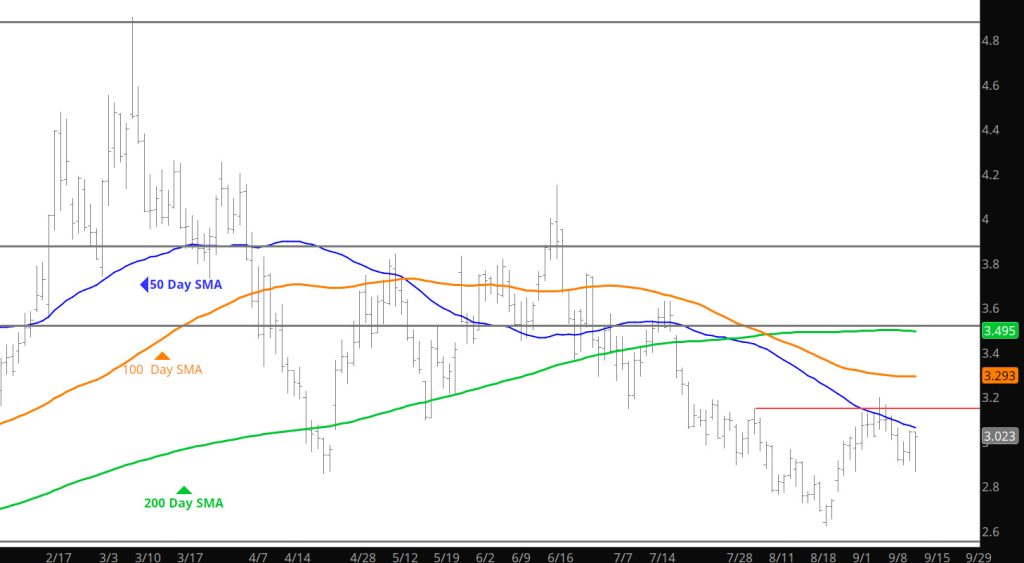
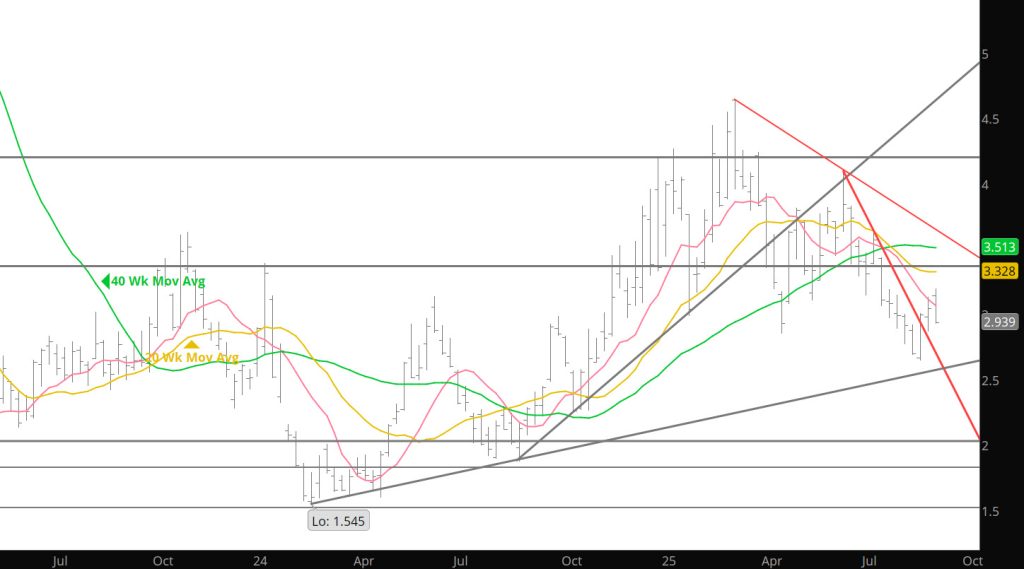
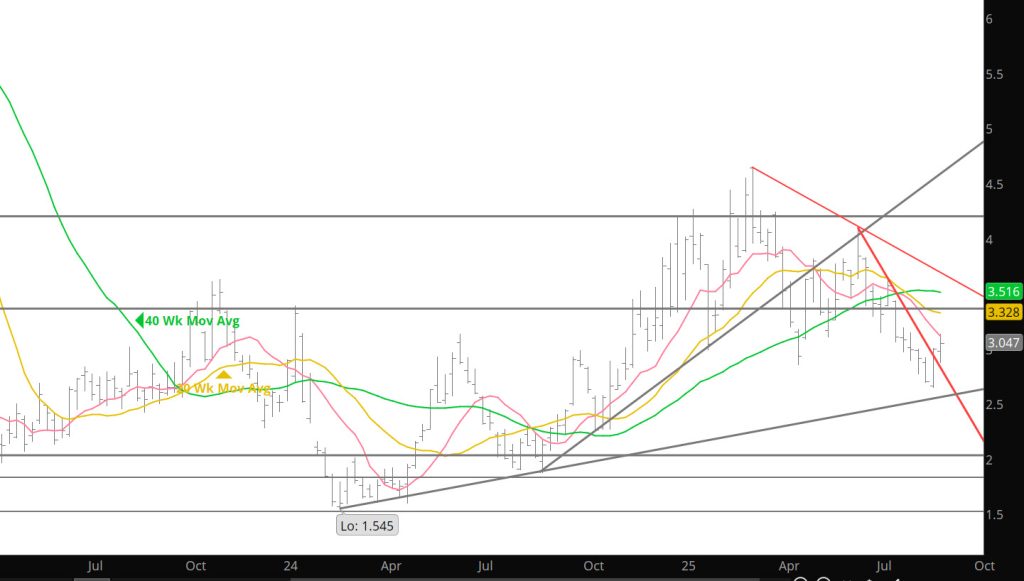
Although working against the current of seasonal price negative bias, until fading on Friday October gas had closed higher for eight straight days (it has been a while since any contract did that). For the holiday shortened trading week the prompt was the only contract to gain, + $.051, but November’s loss was negligible, $.005. The other ten months of the one year strip lost $.035 to $.071.
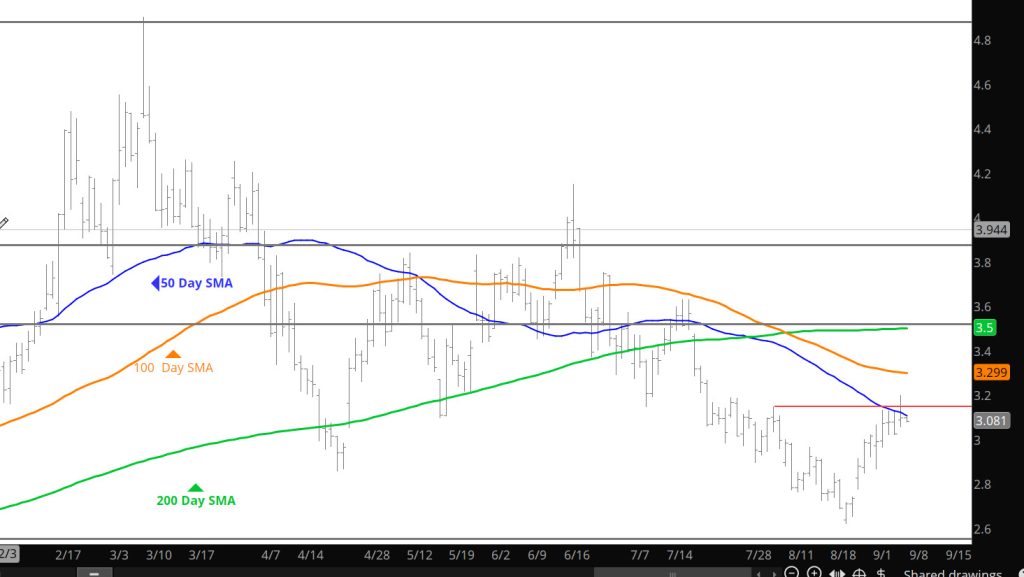
The price level attracting sellers was obvious…the declining 50 – day SMA. The highs of three of this week’s four trading days were within a penny of the gradually falling moving average. Interestingly enough, the continuation 50 – day SMA was an influence then as it was during the past week, once breached it became support for a rally that extended through October ‘24’s last trading day. Last year, following October ‘24s rally into expiration new prompt November gas up the gains and returned to test the 50 – day before December kicked off the real Q4/Q1 rally that finally peaked on March 10th.
The consensus of technical indications, which began to improve last week, improved enough to be rate neutral – negative after remaining negative for nine weeks. A week ago neither volume nor open interest confirmed lower lows…this week average daily volume and open interest increased along with October. Prompt gas reversed from more than two standard deviations below the 20 – week. This week’s higher trade tends to confirm that reversal. The daily ATR increased a little…from $.126 to .$131. The weekly ATR fell to $.380. The moderation of volatility may become a significant technical factor.
Major Support: $3.00-$2.97, $2.843, $2.727, $2.648
Minor Support :
Major Resistance: $3.061, $3.16, $3.192, $3.25-$3.31,$3.39, $3.62, $4.168, $4.461,