OK Something Maybe Forming

Daily Continuous

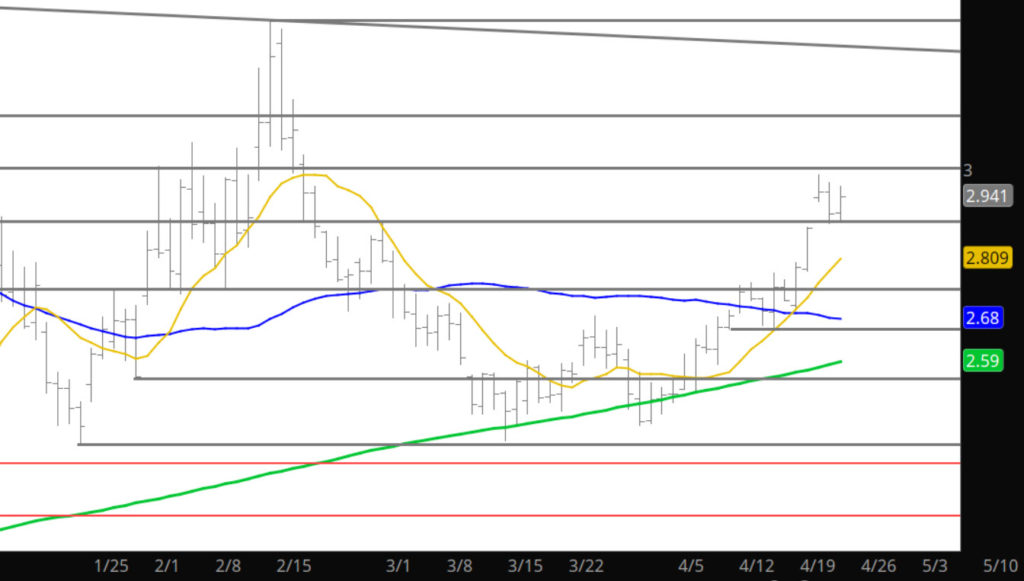
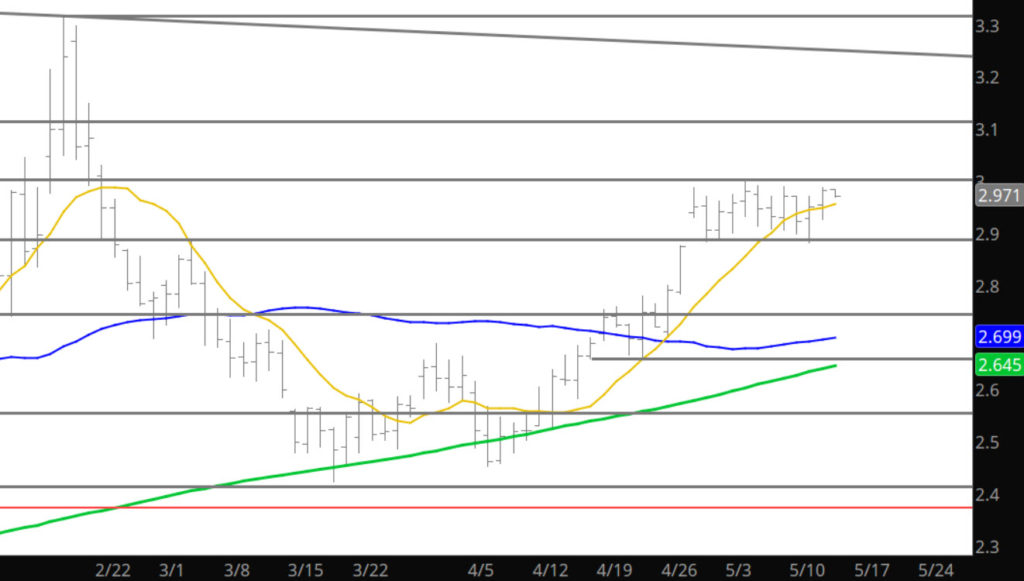
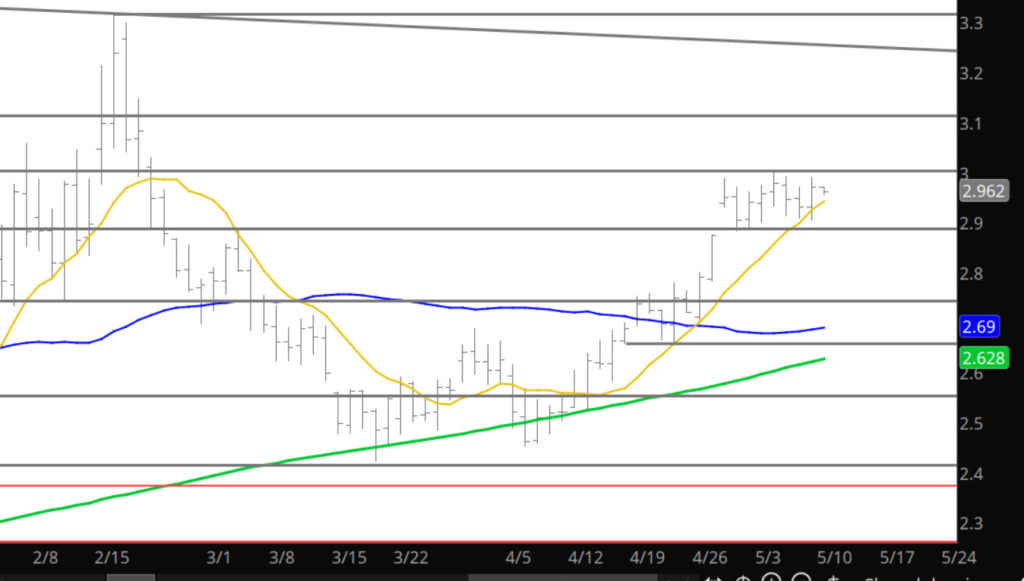
Well, perhaps the market is starting to gather the fortitude to attack the $3.00 top end of the range as most of the other commodities have during the last month (some on numerous occasions). If gas does not garner the momentum to break above $3.00 it is miss a great chance to do so. From my trading perspective, I am not going to be selling at the resistance on the first opportunity and rather observe how the market behaves. We all know what will happen if the rally falls short again.

Support: $2.78, $2.71-$2.70, $2.658, $2.52, $2.422-$2.414
Minor Support:$2.876, $2.694, $2.483, $2.162
Major Resistance: $2.98-$3.05, $3.12
Minor Resistance:
Really

Daily Continuous

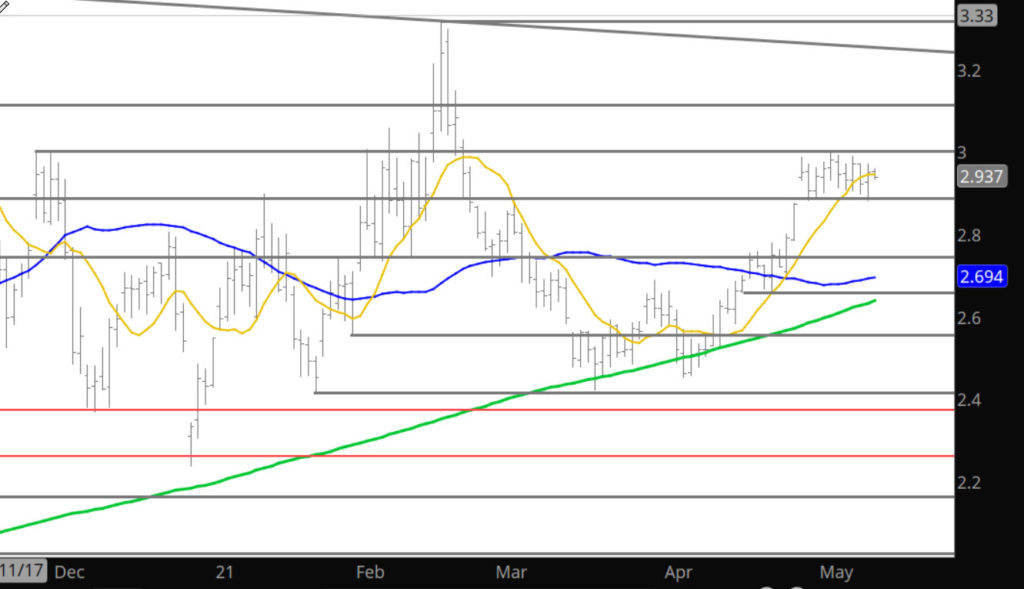
Getting tired of this no trade – trade. May have to update in the future with oil, corn, soybeans or copper as they seem to be taking all the trade oxygen out of the markets. Will continue to update gas but feeling terrible about being uninformative to you folks who pay fees for basically the same analysis day after day. Stick with the ranges and hope Thursday will usher a change.

Support: $2.78, $2.71-$2.70, $2.658, $2.52, $2.422-$2.414
Minor Support:$2.876, $2.694, $2.483, $2.162
Major Resistance: $2.98-$3.05, $3.12
Minor Resistance:
To read The Daily Call you must be a subscriber (Current members sign in here. )

New Week — Nothing Changes

Daily Continuous

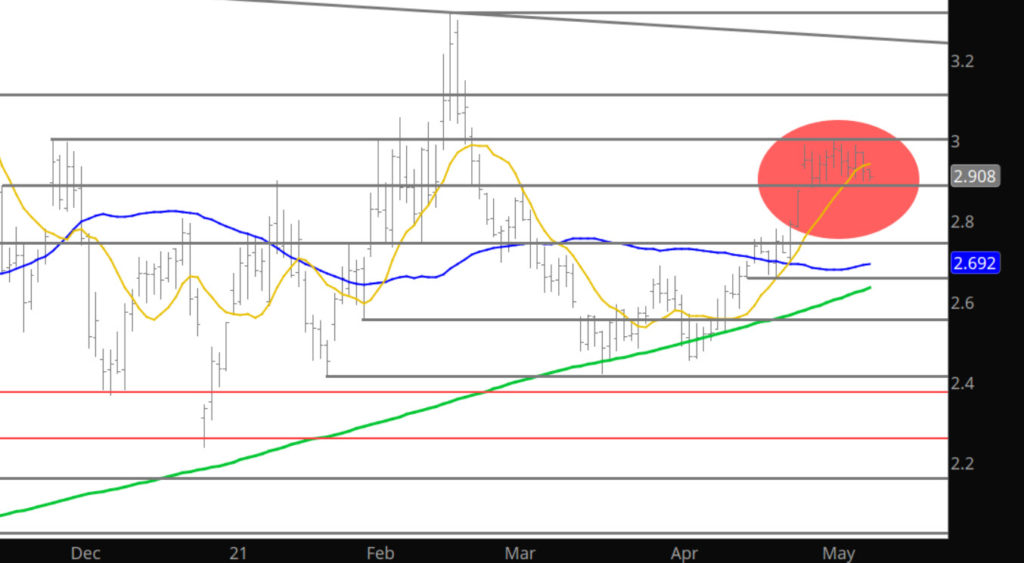
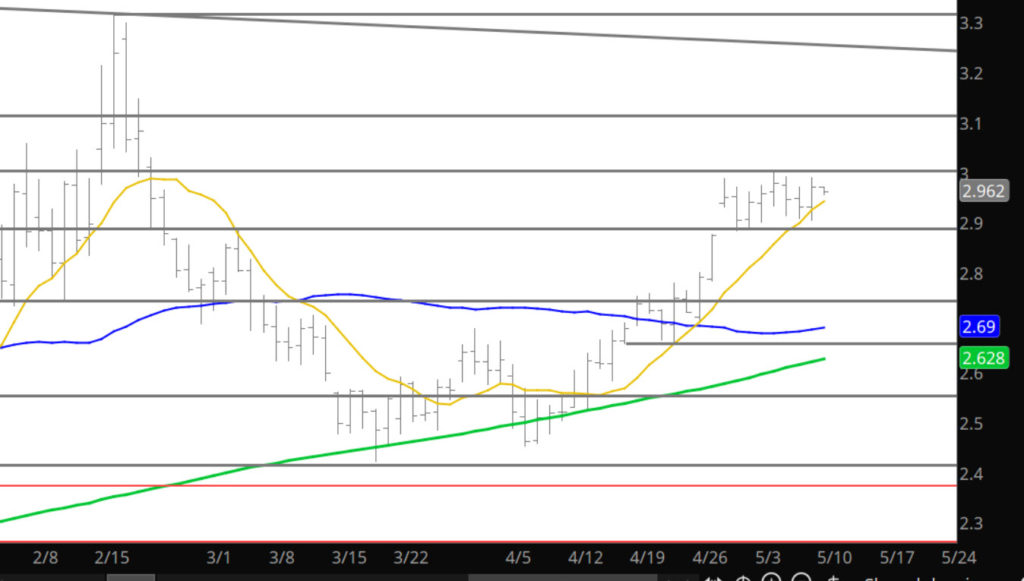
Notice the red shaded area and you will observe the huge (tongue in cheek) volatility in the spot contract this month. Nothing changed yesterday either, so consider my thoughts and insights holding for today.

Support: $2.78, $2.71-$2.70, $2.658, $2.52, $2.422-$2.414
Minor Support:$2.876, $2.694, $2.483, $2.162
Major Resistance: $2.98-$3.05, $3.12
Minor Resistance:
To read The Daily Call you must be a subscriber (Current members sign in here. )

Rally Maintains Strength

Daily Continuous
Weekly Continuous

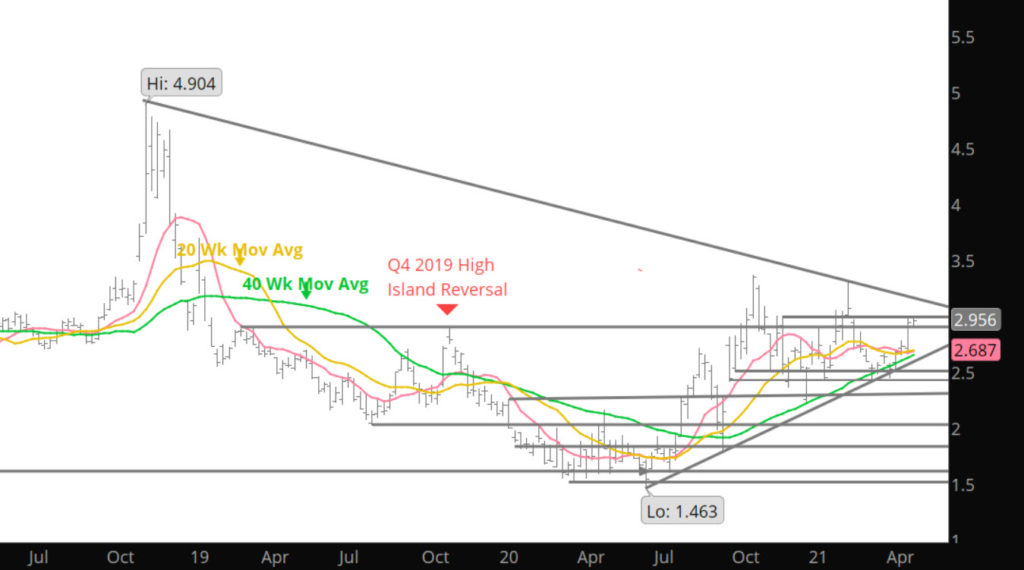
Last week continued the consolidation process in a fairly tight range. It may turn out that the prompt June extends the rally toward the upper boundary of the developing triangle ( trend line declining from the October – November and February highs, the current value of which is 3.256 in the Daily Chart above). There is historical precedent for June extending the rally later during its tenure as prompt. In ’19 the high of June’s tenure as prompt didn’t trade until 05/20, in ’18 June’s high traded coincident with expiration. From a historical stand point — since 2007 prompt June has traded through the calendar April high in 12 of 14 years (the only exceptions were ’14 and ’19) . The first trading day of May this year made it 13 of 15.

To read The Daily Call you must be a subscriber (Current members sign in here. )

From Where Does the Break Occur

Daily Continuous

To the up or to the down is the question natural gas has before because this range is going to break. Go into some of the historical trends for the June contract on the Weekly side — but it is starting to look to this trader that the prices are going to do both events (break down and break above) — but just not sure which is first. Don’t see the break down garnering enough momentum below $2.80 (see the expiration range on the May contract) and the break above is going to banging its head at several areas (discussed in Weekly) if it ever breaks above $3.00.

Support: $2.78, $2.71-$2.70, $2.658, $2.52, $2.422-$2.414
Minor Support:$2.876, $2.694, $2.483, $2.162
Major Resistance: $2.98-$3.05, $3.08, $3.12
Minor Resistance:

To read The Daily Call you must be a subscriber (Current members sign in here. )

Lower Volume, Low Volatility- HMM

Daily Continuous

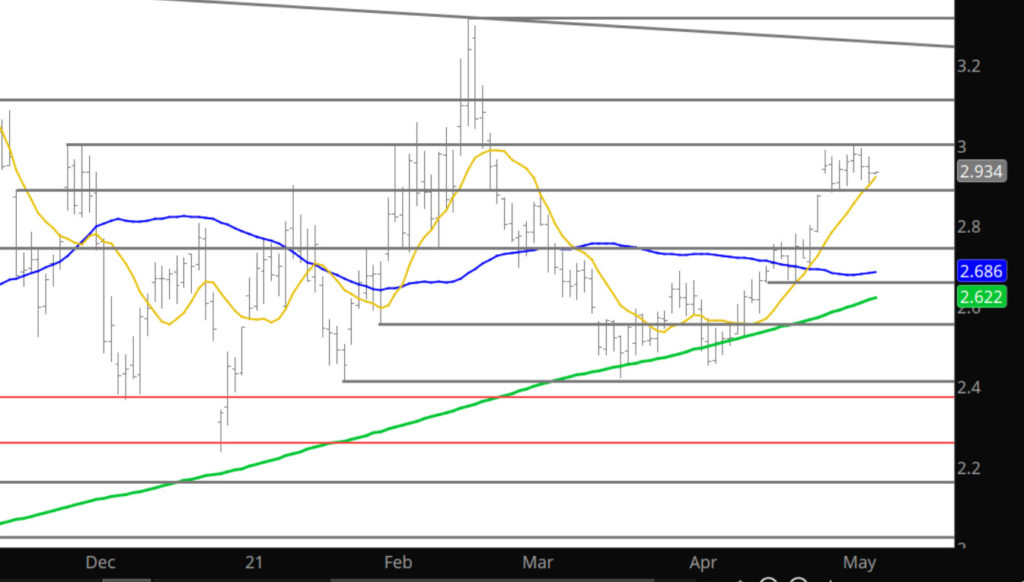
Not sure what to say here but prices seem to be consolidating in the $2.90’s instead of testing mid-term support for the base of the range. We shall see what happens as the month moves on but consistent below average volumes (comparatively) over the last four days and a volatility in range trade condensing, are not consistent technical indicators of a break down or a break out. From there come more consolidation until something happens to steer trader’s actions.

Support: $2.78, $2.71-$2.70, $2.658, $2.52, $2.422-$2.414
Minor Support:$2.876, $2.694, $2.483, $2.162
Major Resistance: $2.98-$3.05, $3.12
Minor Resistance:
To read The Daily Call you must be a subscriber (Current members sign in here. )

That Was Not A Retrace

Daily Continuous

That small decline is not to be considered a retracement of the recent gains- but rather a slight decline testing near term support. Why the significance? Prices need to retrace $.10-$.15 in order to build a base to launch a serious run at resistance. Yesterday’s declines were not a launching pad for further gains. Keep working the range in trading activities.

Support: $2.78, $2.71-$2.70, $2.658, $2.52, $2.422-$2.414
Minor Support:$2.876, $2.694, $2.483, $2.162
Major Resistance: $2.98-$3.05, $3.12
Minor Resistance:
To read The Daily Call you must be a subscriber (Current members sign in here. )

It is Certainly Giving It a Try

Daily Continuous

You can clearly say it is trying to break above $3.00 (for the last 5 trade days) and force some shorts to cover — but by the lack of success– the market may be signalling it isn’t ready yet. Continue to sell at the top of the range– keep stops tight and be buying on any declines into the $2.80’s this week.

Support: $2.78, $2.71-$2.70, $2.658, $2.52, $2.422-$2.414
Minor Support:$2.876, $2.694, $2.483, $2.162
Major Resistance: $2.98-$3.05, $3.12
Minor Resistance:

To read The Daily Call you must be a subscriber (Current members sign in here. )

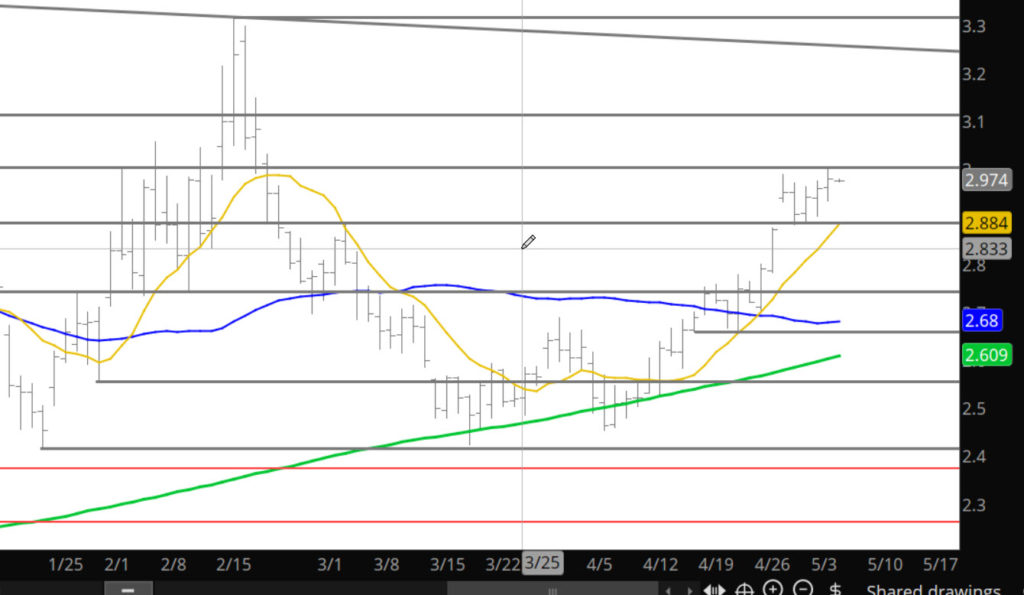
Slowly Moving Nowhere — Hello Consolidation

Nice quiet day doing nothing which we all know is a market consolidating for the next move. Is it building a base for the next run upward or is it defining the the top end for a collapse downward. Put you money where you want– I think both are in order with a slight decline to test the mid $2.80’s but there is no technical area there for support– not until $2.783- as prices just rocked through the $2.80’s on the way up. From there the $3.00 area is the target.

Support: $2.78, $2.71-$2.70, $2.658, $2.52, $2.422-$2.414
Minor Support:$2.876, $2.694, $2.483, $2.162
Major Resistance: $2.98-$3.05, $3.12
Minor Resistance:
To read The Daily Call you must be a subscriber (Current members sign in here. )

Stronger Close to the Week

Daily Continuous

A higher weekly close for six of seven weeks can be interpreted as bullish but would not rule out a challenge to the support between the $2.87-$2.82 zone. Key area for price action near term as prices may look for support and should they garner the power to trade above $3.00 then it will adjust the summer strip picture.

To read The Daily Call you must be a subscriber (Current members sign in here. )