To read The Daily Call you must be a subscriber (Current members sign in here. ) Start your subscription today.
Author: Willis Bennett
Here We Go Again
To read The Daily Call you must be a subscriber (Current members sign in here. ) Start your subscription today.
Yet Another New High
To read The Daily Call you must be a subscriber (Current members sign in here. ) Start your subscription today.
Gains Not Built On
To read The Daily Call you must be a subscriber (Current members sign in here. ) Start your subscription today.
Consider the Highs Tested
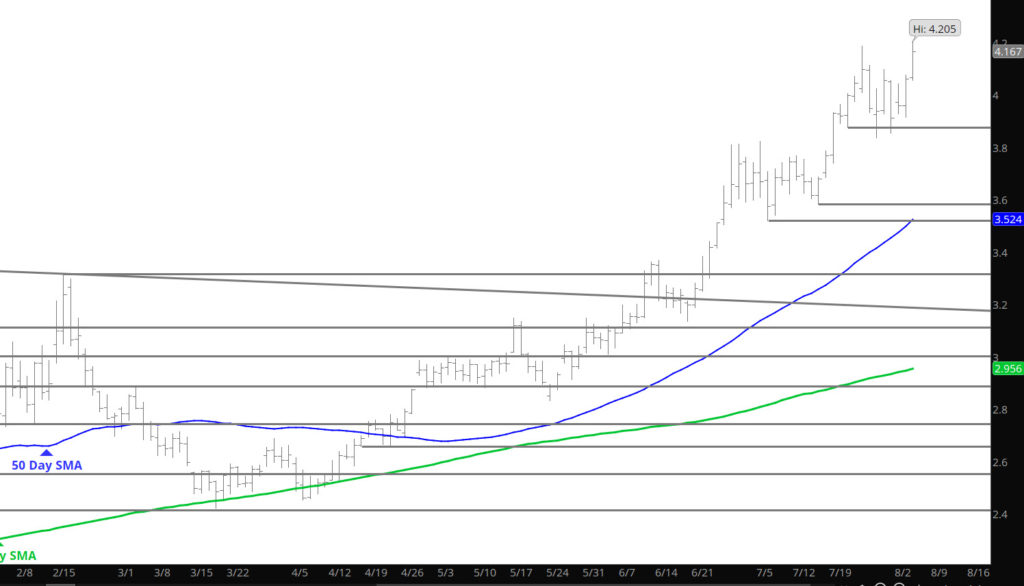
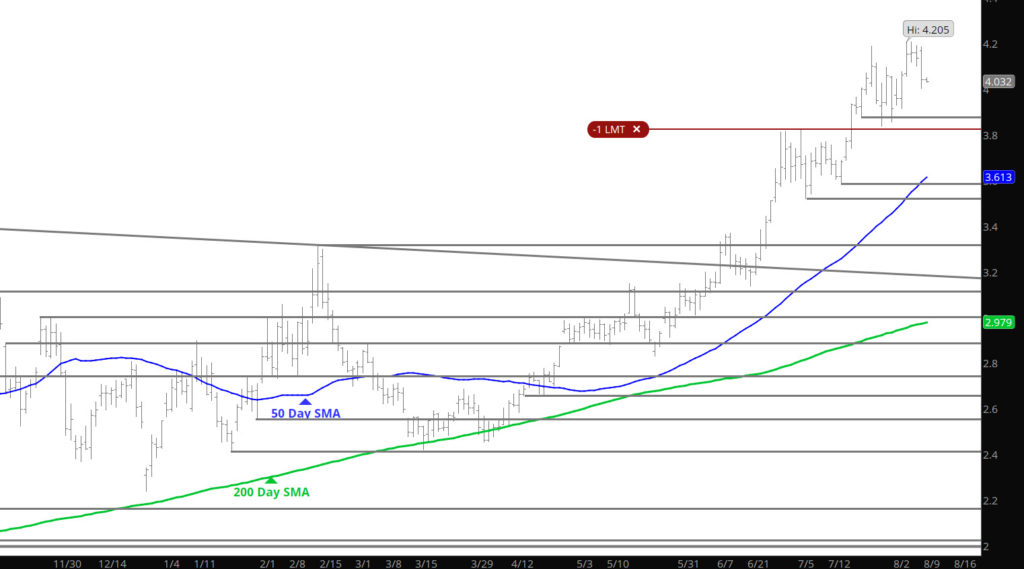
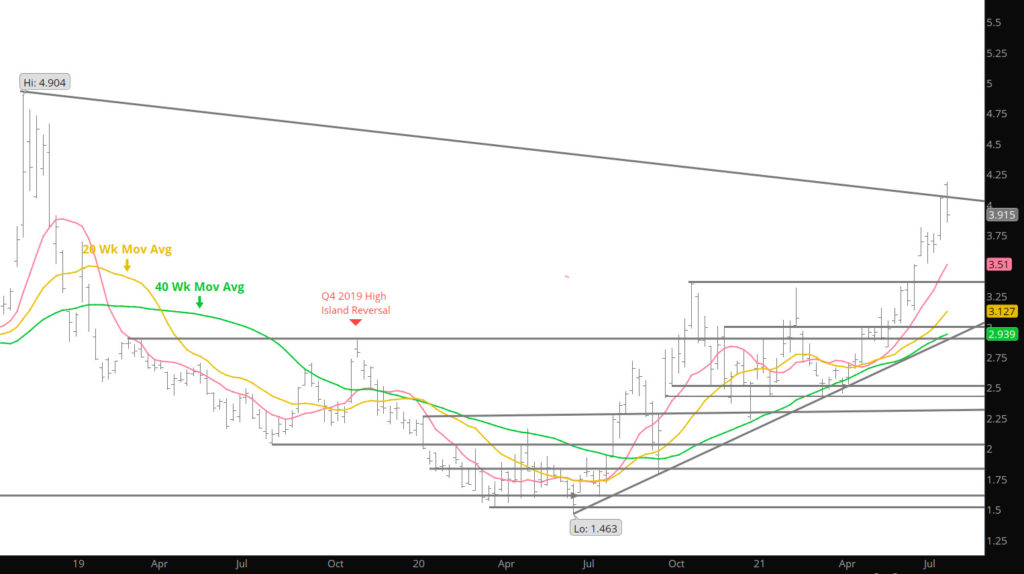
That was exciting and the potential was not over-looked at Ecom as the Weekly section made it clear that rallies were still on the menu for Natural Gas.….On a weekly closing basis, prompt gas traded a technically price negative reversal lower but without the volume spike that customarily accompanies intermediate term highs. That should provide eager bears with some food for thought. The market has not confirmed the “all clear” against additional runs….. Finishing near the highs yesterday, expecting additional gains is likely but last week’s price action reduced the Weekly RSI under extreme levels but yesterday sent it right back higher and into the extreme zone. By consolidating the run last week (if only for a couple of days) the daily momentum indicator has not re-entered nor is it challenging the extreme levels of last week. Unlike last week when the highest daily volume was during the declines on Friday, yesterday posted a higher than average volume day.
Yesterday’s run should act as a warning signal to the eager and aggressive bears as many got their eyelids ripped off during the run. This trader is waiting for a more definitive move by the market before trying to catch a rocket ship. Am still expecting additional consolidation but now there are some doubts creeping into my expectations of a test of major support down to or below $3.75-$3.70 during the seasonal declines. The market will decide.
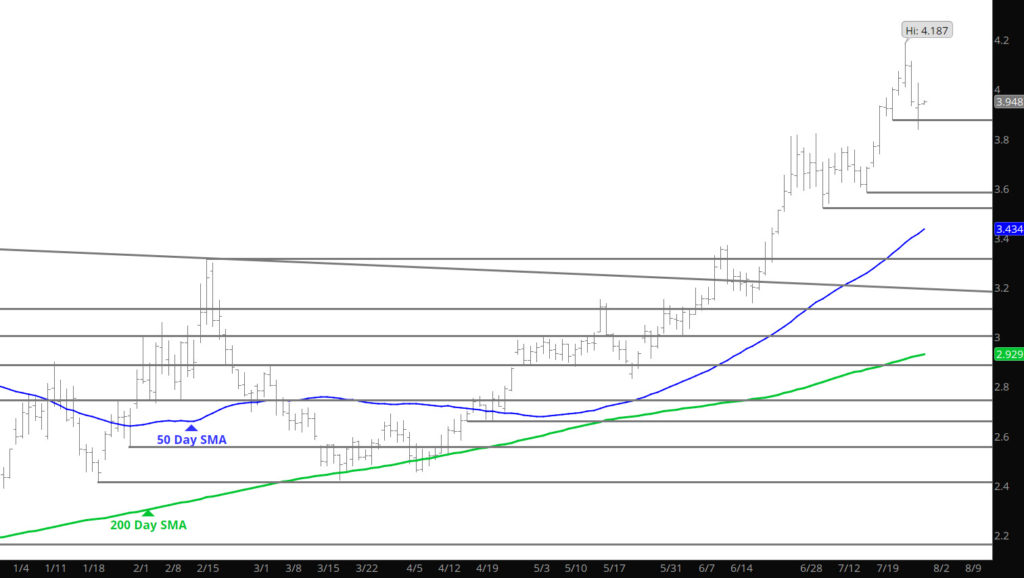
Major Support: $3.87, $3.722, $3.58, $3.538-$3.511, $3.385, $3.368-$3.316, $3.198,
Minor Support: $3.821, $3.508-$3.485
Major Resistance: $4.187, $4.238
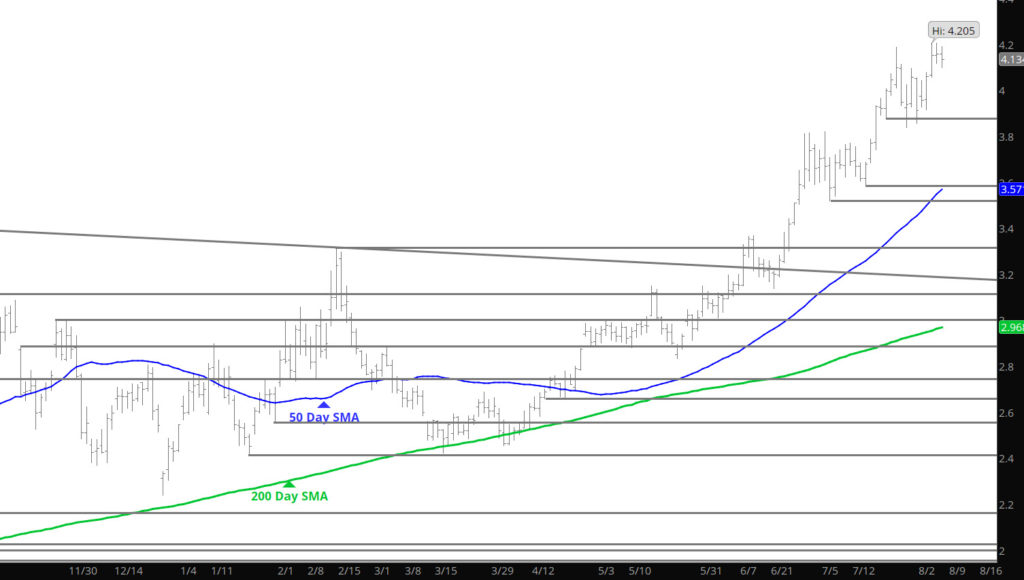
Change -Early Strength Holds
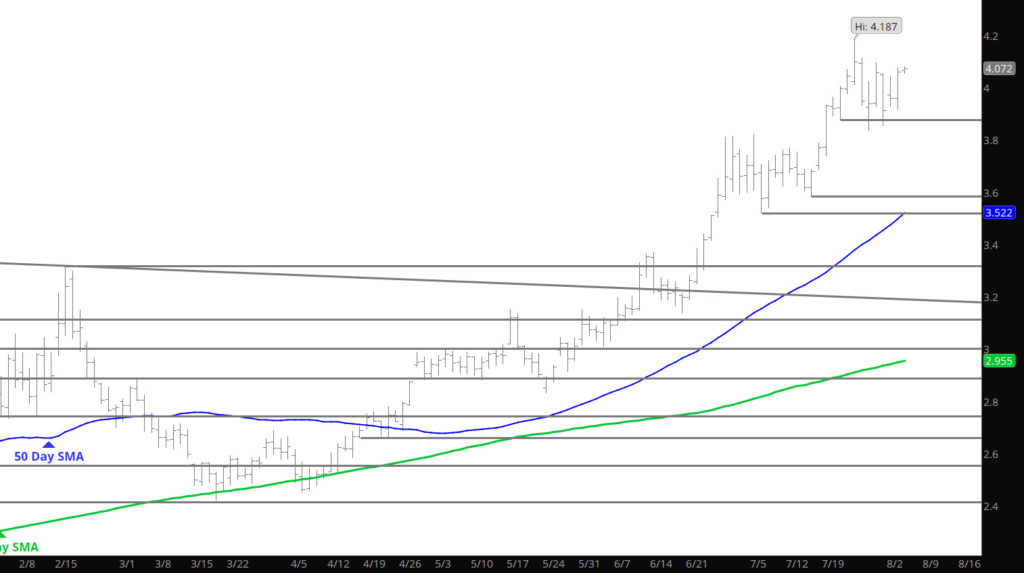
Unlike Monday’s action, prices held the early strength closing just off the highs. The run questions my comment yesterday defining the high end of the range, perhaps we need to test the highs from last week or the highs for Sep contract from last week ($4.165).
Major Support: $3.722, $3.58, $3.538-$3.511, $3.385, $3.368-$3.316, $3.198,
Minor Support: $3.87, $3.821, $3.508-$3.485
Major Resistance: $4.054-$4.094, $4.187, $4.238
Early Strength Waned
To read The Daily Call you must be a subscriber (Current members sign in here. ) Start your subscription today.
Consolidation Continues
To read The Daily Call you must be a subscriber (Current members sign in here. ) Start your subscription today.
Declines Expected With Seasonal Weakness
To read The Daily Call you must be a subscriber (Current members sign in here. ) Start your subscription today.
Range Type Expiration
To read The Daily Call you must be a subscriber (Current members sign in here. ) Start your subscription today.