Consolidation Brings Volatility Weakness

Weekly Continuous

Spoke in Good Friday analysis about the declining volatility that the current market had been maintaining. Nothing changed last week as the prices remained in a tight range environment, seemingly going nowhere. Maintaining above the 200 day moving average but closing just below the 40 Week Moving Average, prices seem to want to test the low end of the current range $2.45-$2.42 and very well may but the key is what happens upon that test — a break below will likely bring the lows from last Dec into play a test and failure will send a much different signal.

Going back to the volatility and lack of it in the current market and the potential impacts for future prices. Look at the chart below, it represents the continuous price movement (upper pane) and the daily range for prices over the last 14 days (lower pane):

To read The Daily Call you must be a subscriber (Current members sign in here. ) Start your subscription today.

Range Range Range

Daily Continuous

Quiet trade continues to haunt the nat gas market with last week’s low not really seriously challenging the mid-term support levels before rebounding. Early trade last night shows the market stronger. Don’t put a lot of money chasing Sunday night rallies. Went into some of the longer term aspects of the reduced volatility and market impact in the Weekly section, suffice to say that I am not convinced of long term additional significant declines considering the current status of the market (per Weekly section). Play the range.

Support: $2.422-$2.414, $2.373$2.356,$2.255-$2.176
Minor Support: $2.483, $2.162
Major Resistance: $2.74-$2.789, $2.89, $2.98-$3.05,
Minor Resistance:$2.806

To read The Daily Call you must be a subscriber (Current members sign in here. ) Start your subscription today.

Storage Report Does Nothing

Daily Continuous

Interesting that the volume rose a little yesterday as the prices held firm on the storage release that was well within expectations. This market has been consolidating for nearly two months (though within different ranges) with open interest very close (within 4,000 contracts) to where it was on March 8th. Volume has had some good days and some terrible days and yesterday’s volume was the third largest since March 8th. What to do — patience and buy the dips with tight stops as I mentioned earlier in the week. It is not conclusive that this market has the commitment to do diddly.

Support: $2.422-$2.414, $2.373$2.356,$2.255-$2.176
Minor Support: $2.483, $2.162
Major Resistance: $2.74-$2.789, $2.89, $2.98-$3.05,
Minor Resistance:$2.806

To read The Daily Call you must be a subscriber (Current members sign in here. ) Start your subscription today.

OOPS– Declines Didn’t Extend This Time

Daily Continuous
Spot May Contract

Well, I warned you that prices had not accomplished much with the declines and had to prove the point by breaking down through serious support levels. No such event and I did not even need the stop losses. Market should now test the resistance area and remain in this consolidation process.

Support: $2.422-$2.414, $2.373$2.356,$2.255-$2.176
Minor Support: $2.483, $2.162
Major Resistance: $2.74-$2.789, $2.89, $2.98-$3.05,
Minor Resistance:$2.806

To read The Daily Call you must be a subscriber (Current members sign in here. ) Start your subscription today.

Possible Breakdown

Daily Continuous

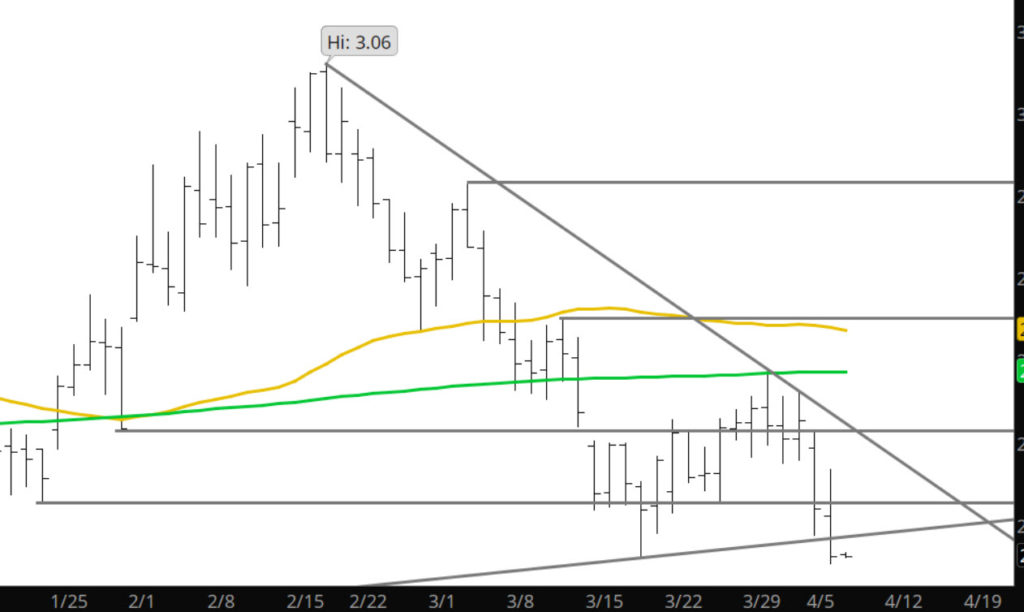
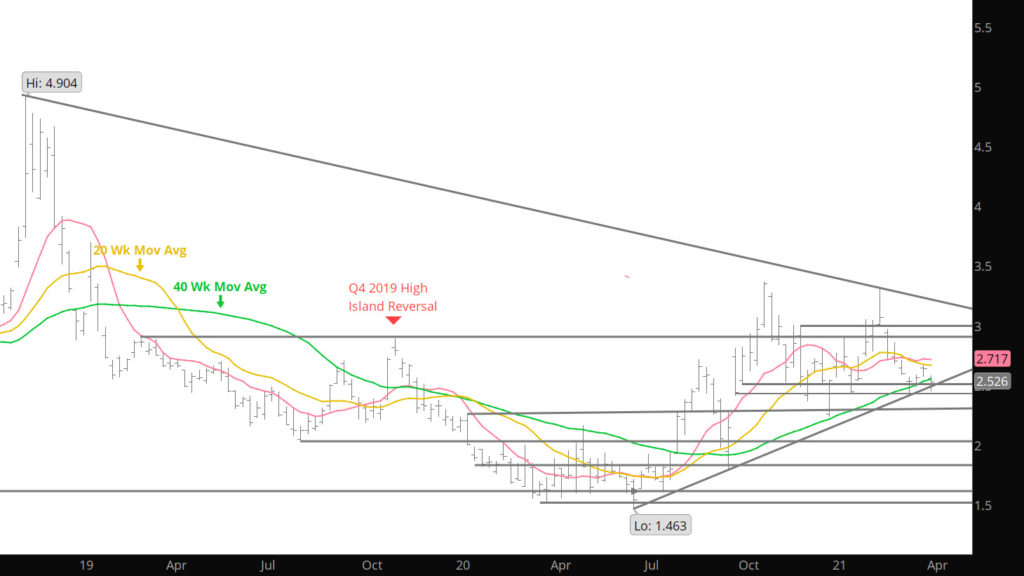
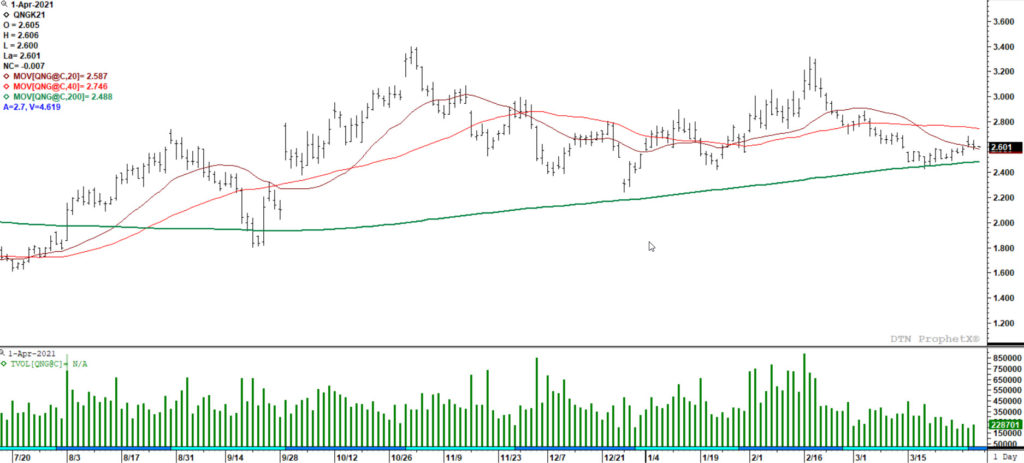
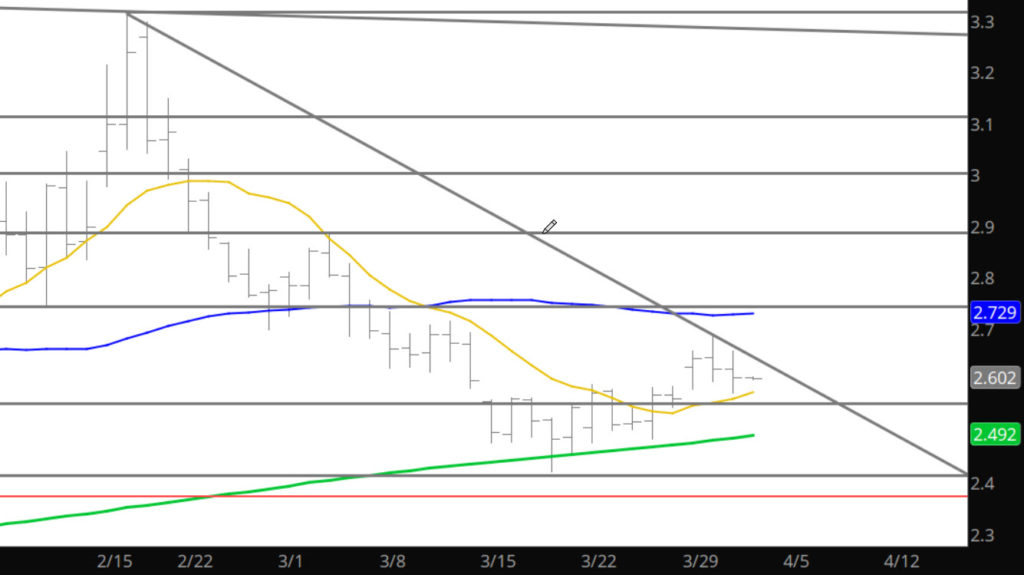
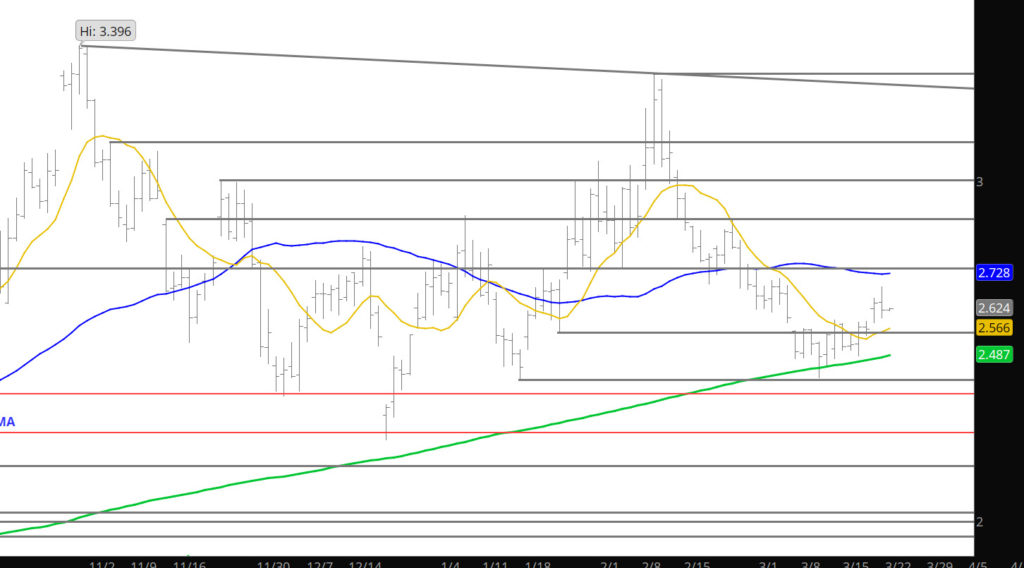
Finally got a probe at the close to break below the March lows. While bearish from a technical standpoint, if this decline is made of the power to rock lower it will need some daily declines testing and breaking further support zones continuing lower. Other than shorting — may think about buying the dip with stops tight.

Support: $2.422-$2.414, $2.373$2.356,$2.255-$2.176
Minor Support: $2.483, $2.162
Major Resistance: $2.74-$2.789, $2.89, $2.98-$3.05,
Minor Resistance:$2.806

Declines to Test Support- Range Continues

Daily Continuous

Well, guess the holiday got some bears fired up, but they could only challenge (and short of that) the lows from March. Nothing to keep this trader from buying support. Lets see if they have the power to drive to the next level.

Support: $2.422-$2.414, $2.373$2.356,$2.255-$2.176
Minor Support: $2.483, $2.162
Major Resistance: $2.74-$2.789, $2.89, $2.98-$3.05,
Minor Resistance:$2.806

To read The Daily Call you must be a subscriber (Current members sign in here. ) Start your subscription today.

Higher Range — Same Action

Daily Continuous
Spot May Contract

Prices last week ran just up to the 200 Day SMA in the May Contract before failing and retracing back to the middle of the range. Spoke in the Good Friday observations about volume and the lack thereof in the current environment and last week was on of the lowest 4-Day weekly volumes in many years. The shorts loaded up last month (seemingly on Mondays) and now they seem limited in additional contracts to sell per my writings last week. The low end of the range is $2.52 and the high side is that 200 day SMA in the May contract.

To read The Daily Call you must be a subscriber (Current members sign in here. ) Start your subscription today.

Good Friday Observations

Daily Continuous with Volume

History shows that more often than not seasonal lows trade with declining volume. Volume on Sept 22nd was substantially less than the volume of the day before or day after. The retest of the late Dec low (also a relatively lower volume day) on January 22nd when the January low was traded at 2.414. The technical indication is that whatever downside momentum that was carrying prompt gas to that low, was or was about to be exhausted. Another way of analyzing this the sellers were running out of participation to drive the bid lower. Perhaps, a variation of that pattern is going on right now. A week ago, April gaped lower on Monday, traded quietly in a range for a couple of days then spiked down toward a test of the January low. Interestingly, the volume on 03/18 exceeded that of 01/22 by more than 100,000 contracts, suggesting that there may be enough additional selling (discussed here) to challenge the conventional and moving average support (the 200 day SMA was 2.447) and leave prompt gas below the trend defining 40 week SMA. Since that spike lower with 415,730 contracts traded the market has preformed an “outsideā€ day reversal to the upside (March 24th). Average daily volume for week ending Mar 26th declined an estimated 80,000 contracts from a week earlier and was the lowest since the holiday shortened Christmas week. Perhaps there is additional selling waiting, but last week’s expiration suggests that volume has sufficiently dried up to indicate that there has been a successful test of the January low during March, looking like an intermediate term low with of the construction of the lower boundary of a trading range.

Some additional support for that view can be found in the change in open interest. The last three meaningful increases in the total number of contracts outstanding were on 03/12 (when selling continued into the weekly close, suggesting lower prices were in store when trading resumed discussed here), 03/15-when prices began the next week with a gap lower, and on 03/18-when April tested the 200 day SMA and January low. Those increases indicated that short sellers were throwing increasing positions significantly, attempting to drive it lower. These actions proved successful the first two times. April fell from a high of 2.714 on 03/11 to that 2.422 on 03/18. Since the 03/18 low open interest has declined each day indicating that gains have been significantly attributable to profit taking (the rally around expiration can also support this view) and does suggest that weakness should be bought near term.

To read The Daily Call you must be a subscriber (Current members sign in here. ) Start your subscription today.

Quiet Probe Lower

Daily Continuous

Prices just melted down quietly yesterday in front of the storage report this morning. Not sure that the report will have a serious directional impact — but you never know. Teased you earlier this week on some observations regarding the price action, volume and volatility and will likely be publishing those comment on Friday for your digestion over the weekend. With Easter upon us, this will be my last Daily until after the Holiday.

Support: $2.422-$2.414, $2.373$2.356,$2.255-$2.176
Minor Support: $2.483, $2.162
Major Resistance: $2.74-$2.789, $2.89, $2.98-$3.05,
Minor Resistance:$2.806

To read The Daily Call you must be a subscriber (Current members sign in here. ) Start your subscription today.

Consolidation Is a Bias

Daily Continuous

That title is some “tongue in cheek” but not totally inaccurate. The last two weeks of March trade (April contract) was with in a tight range that could be considered a consolidation pattern. Perhaps the trade in April with May will remain between $2.58 and $2.70 signalling a consolidation pattern. Other options is for the May contract to melt down into the low $2.50’s returning the market to last month’s range, or to rally above the $2.70 area and potentially strong short covering rally. Stay disciplined here and play the ranges.

Support: $2.422-$2.414, $2.373$2.356,$2.255-$2.176
Minor Support: $2.483, $2.162
Major Resistance: $2.74-$2.789, $2.89, $2.98-$3.05,
Minor Resistance:$2.806

To read The Daily Call you must be a subscriber (Current members sign in here. ) Start your subscription today.