To read The Daily Call you must be a subscriber (Current members sign in here. ) Start your subscription today.
Author: Willis Bennett
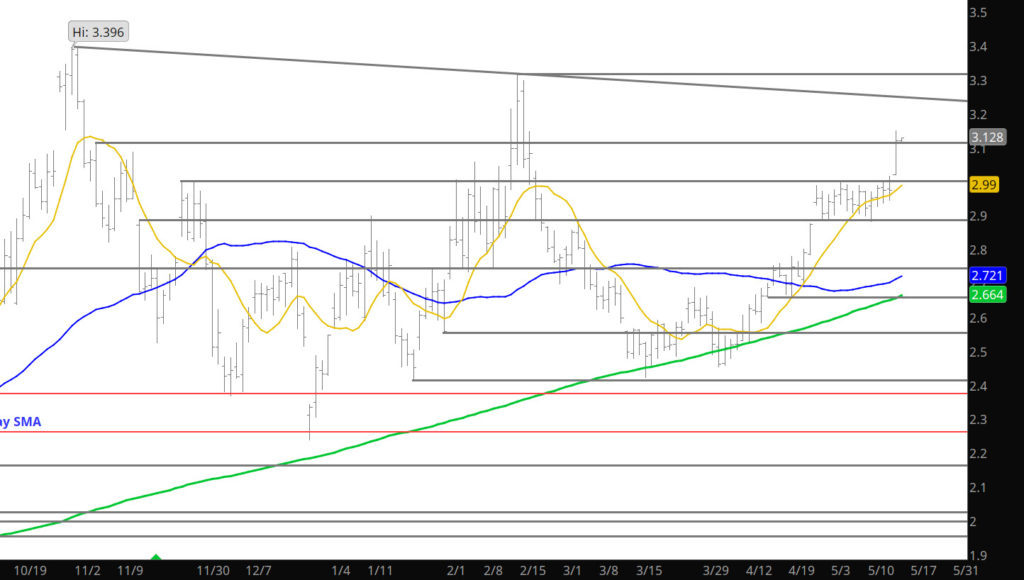
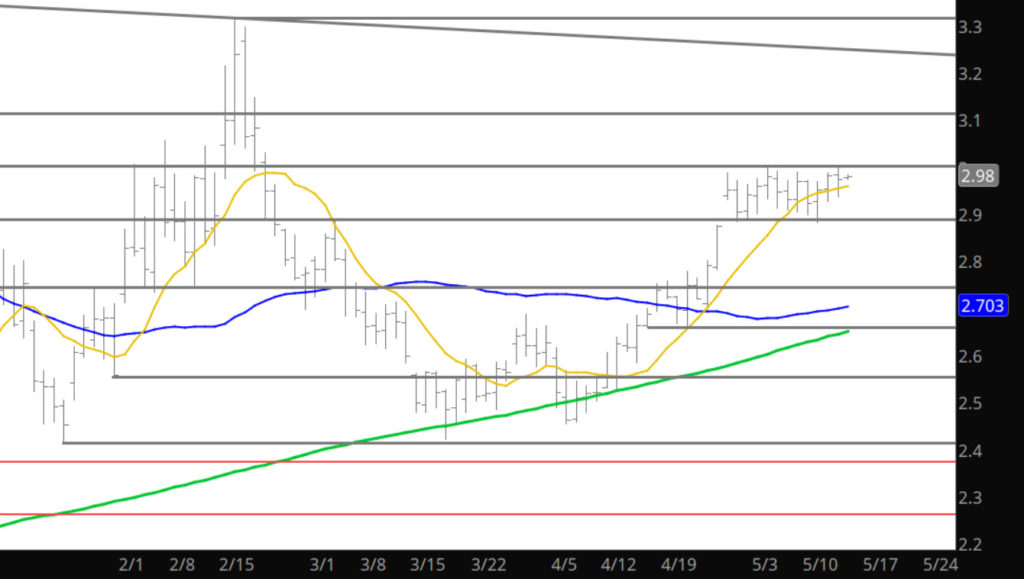
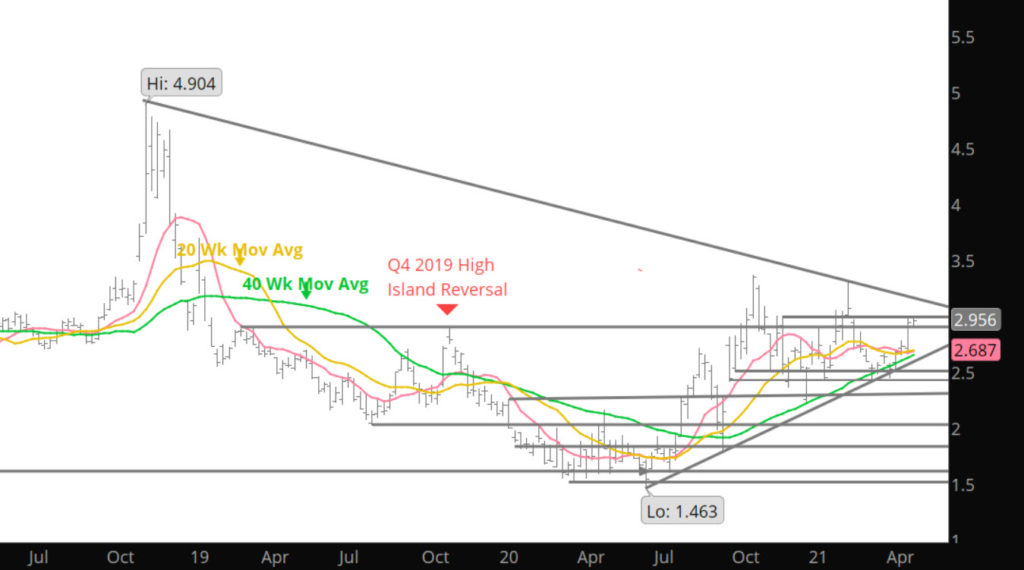
Sunday Night Fake Break or Real
Was going to discuss, yet another failure at key resistance, but the open on Sunday night caught me be surprise. As discussed last week, and this week in the Weekly section, was expecting June contract to meander in the range created during the month, with the break above pushed back until the July contract takes over as prompt– It will be interesting to see if the break above holds during the day. Would be cautious here until the day defines itself.
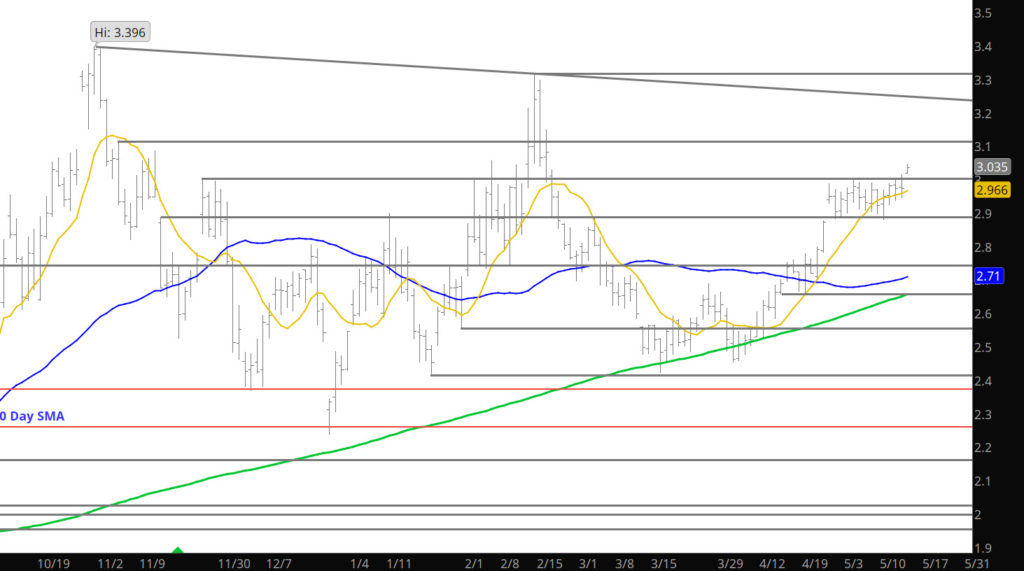
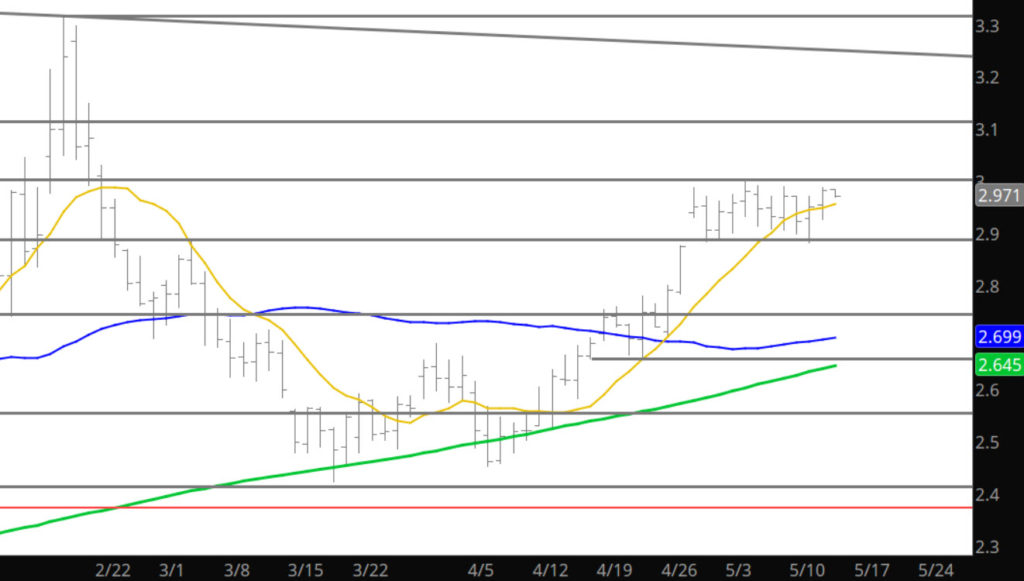
Short Term Break Above
To read The Daily Call you must be a subscriber (Current members sign in here. ) Start your subscription today.
So Much For Those Ideas
To read The Daily Call you must be a subscriber (Current members sign in here. ) Start your subscription today.
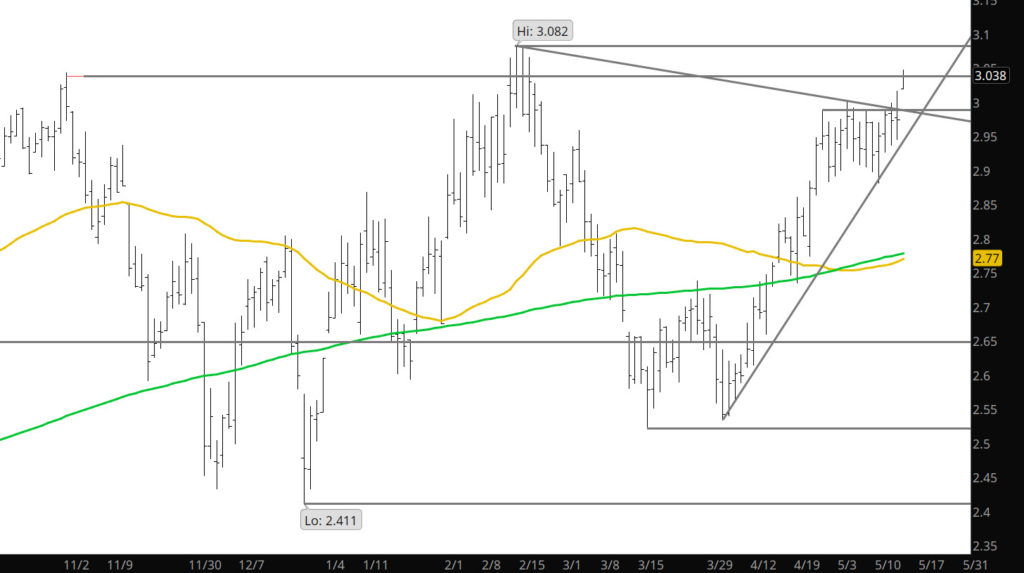
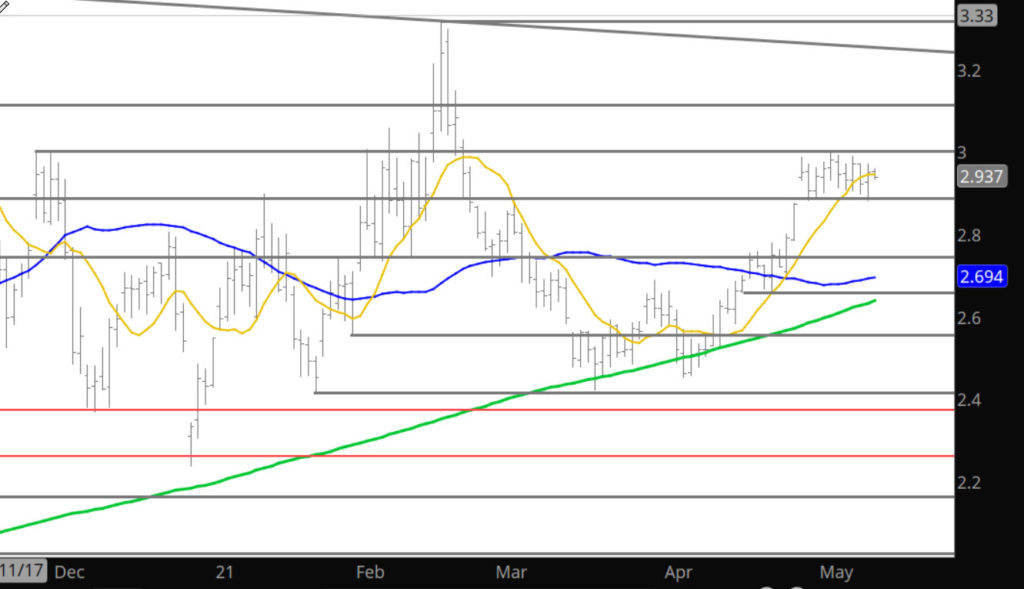
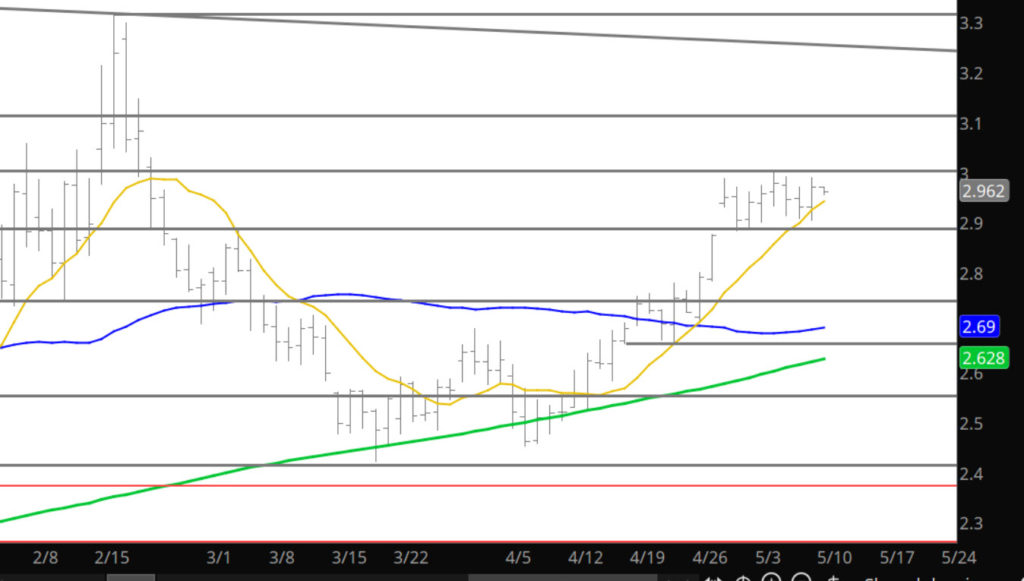
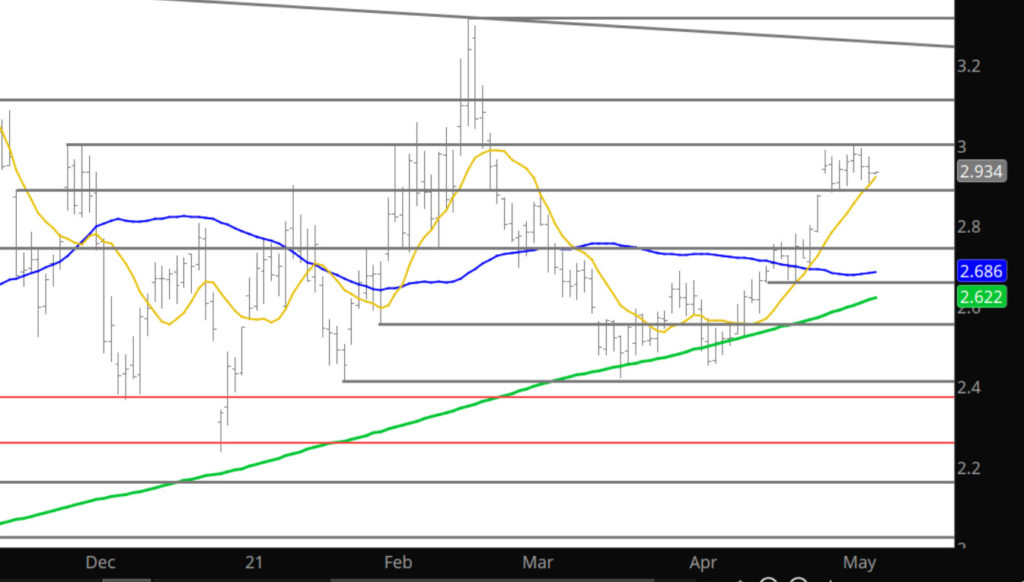
OK Something Maybe Forming
Well, perhaps the market is starting to gather the fortitude to attack the $3.00 top end of the range as most of the other commodities have during the last month (some on numerous occasions). If gas does not garner the momentum to break above $3.00 it is miss a great chance to do so. From my trading perspective, I am not going to be selling at the resistance on the first opportunity and rather observe how the market behaves. We all know what will happen if the rally falls short again.
Support: $2.78, $2.71-$2.70, $2.658, $2.52, $2.422-$2.414
Minor Support:$2.876, $2.694, $2.483, $2.162
Major Resistance: $2.98-$3.05, $3.12
Minor Resistance:
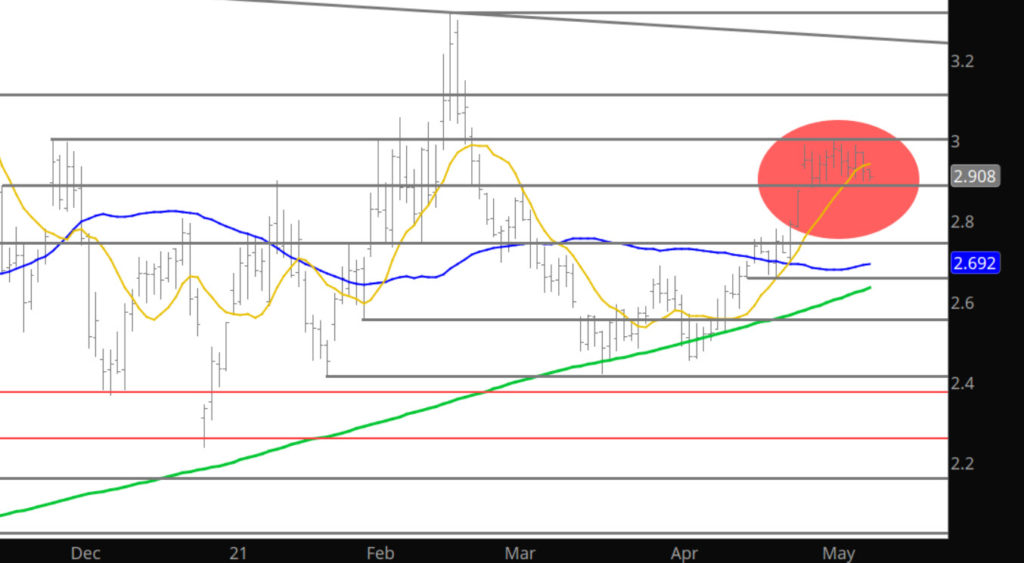
Really
To read The Daily Call you must be a subscriber (Current members sign in here. ) Start your subscription today.
New Week — Nothing Changes
To read The Daily Call you must be a subscriber (Current members sign in here. ) Start your subscription today.
Rally Maintains Strength

To read The Daily Call you must be a subscriber (Current members sign in here. ) Start your subscription today.
From Where Does the Break Occur
To read The Daily Call you must be a subscriber (Current members sign in here. ) Start your subscription today.
Lower Volume, Low Volatility- HMM
To read The Daily Call you must be a subscriber (Current members sign in here. ) Start your subscription today.