Welcomed my second granddaughter yesterday and of course she is just beautiful and healthy. The market got the initial run in prices with the middle east in war and crude up over ten percent. Now the trade will have to evaluate the impact of the war on the LNG markets and carry forward to the US market and during the evaluation would keep the range from Feb active in your mind for buying and selling,
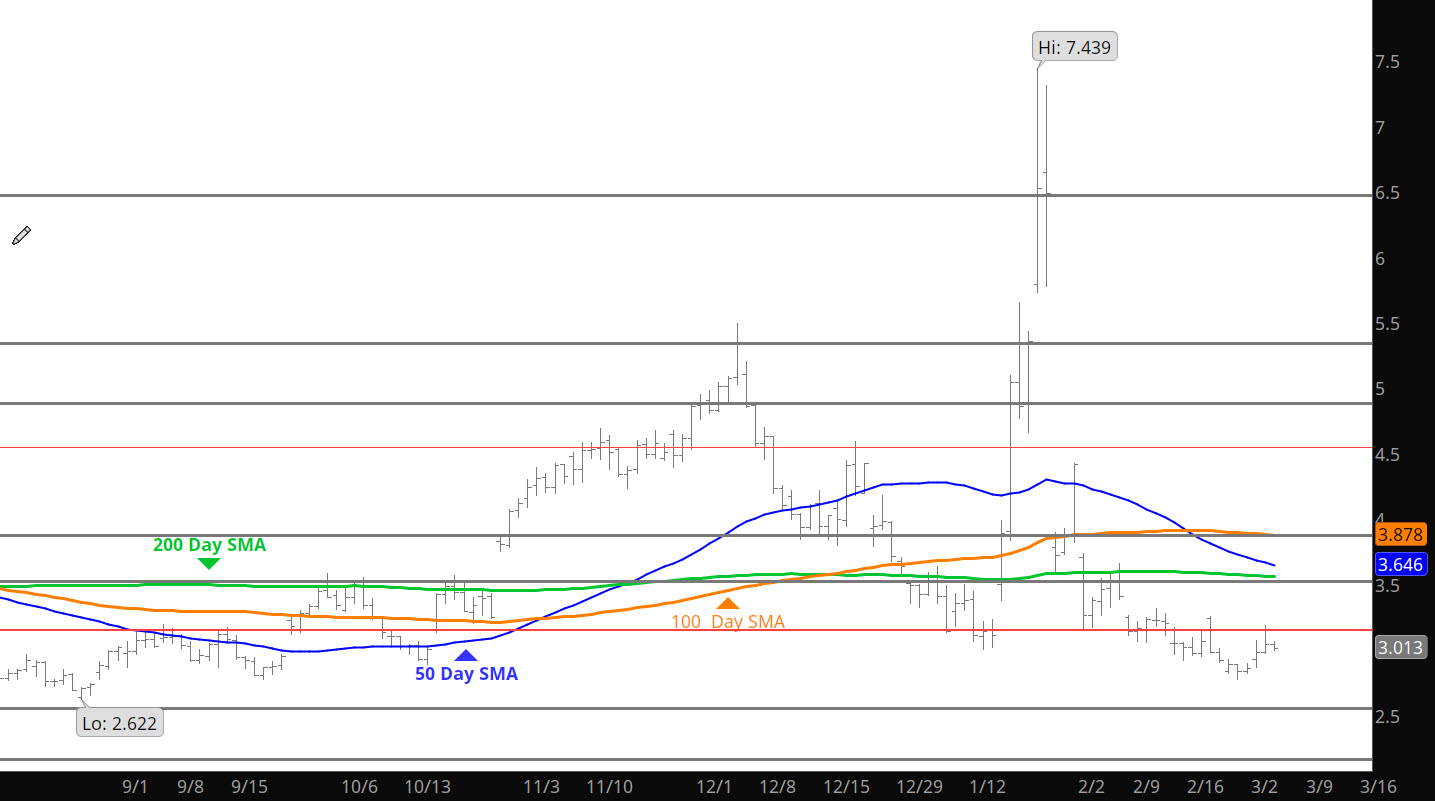
Major Support: $2.87-$2.84, $2.640-$2.57 Minor Support/Resistance : $3.16-$3.148, $3.136 Major Resistance: $3.02, $2.97-$2.93, $3.787-$3.831, $4.063,$4.086, $4.593, $5.333, $5.496
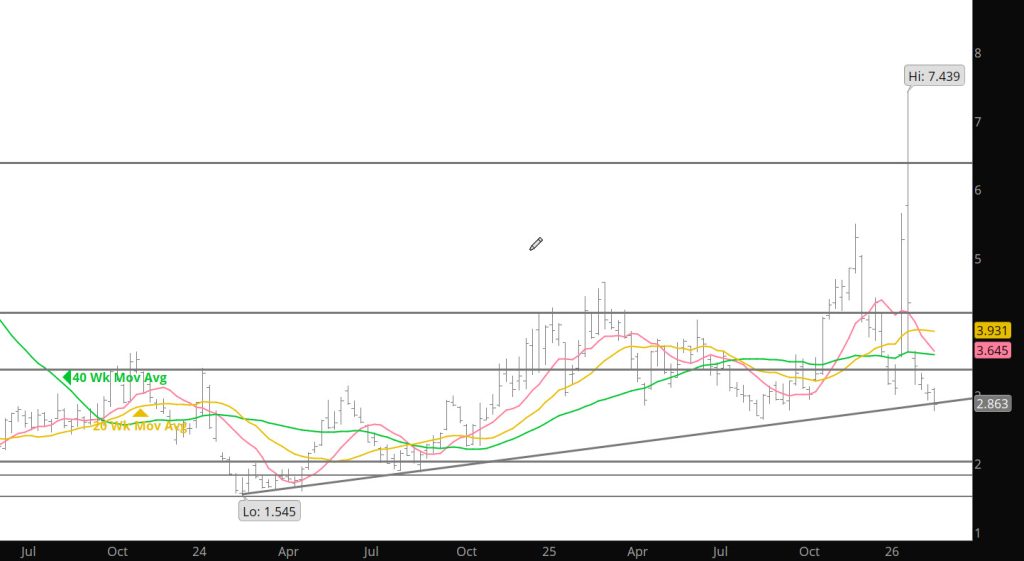
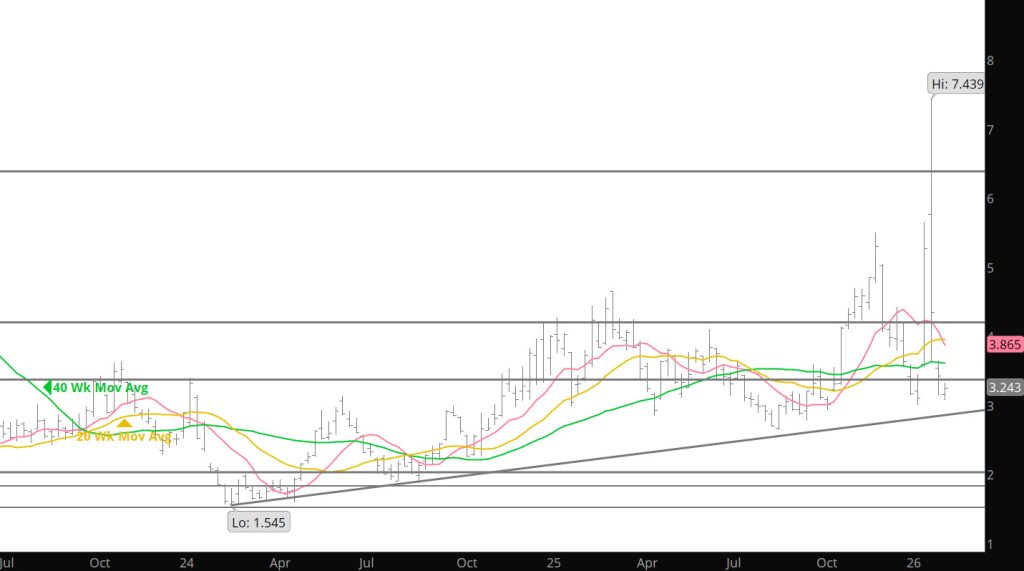
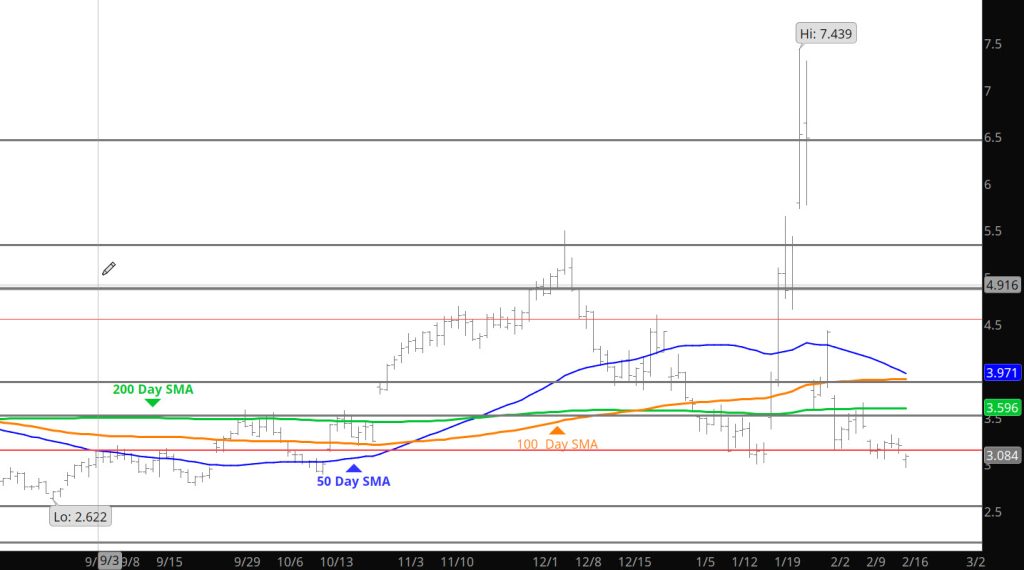
Prompt gas and the April contract traded an “outside” week reversal to the downside to end February below the historically important January low but did so with the lowest volume traded during any week in 2026. The low turnover…which was less than half of the total traded during week ending 01/23, does not nullify the trend line violation (which still needs confirmation) but does suggest that selling pressure necessary to drive April substantially lower is at least to date, absent. Lower price lows on lower volume is a form of divergence.
The technicals are still kind of a mess but are slowly adjusting. A week ago the consensus improved a little…to neutral, this week it forfeited that improvement and reclaimed its price negative bias.: Momentum indicators…both the weekly MACD and RSI are negative with confirmed price negative divergences. Maybe that is indicating another “leg” lower, but the circumstances of the divergences…Feb’s spike higher and March’s whopper of a discount, will likely result in that being a short “leg” and that prompt gas will begin to define the lower limits of an early spring trading range. Still, the inference is that rallies will fail.
Market internals were mixed. Volume fell along with price. As mentioned earlier, a lower price low on lower volume is a form of divergence, in this case a technical positive. Open interest increased indicating an ample supply of contracts offered at a lower price, a technical negative.
Have my second grandchild coming shortly so I will keep tonight short.
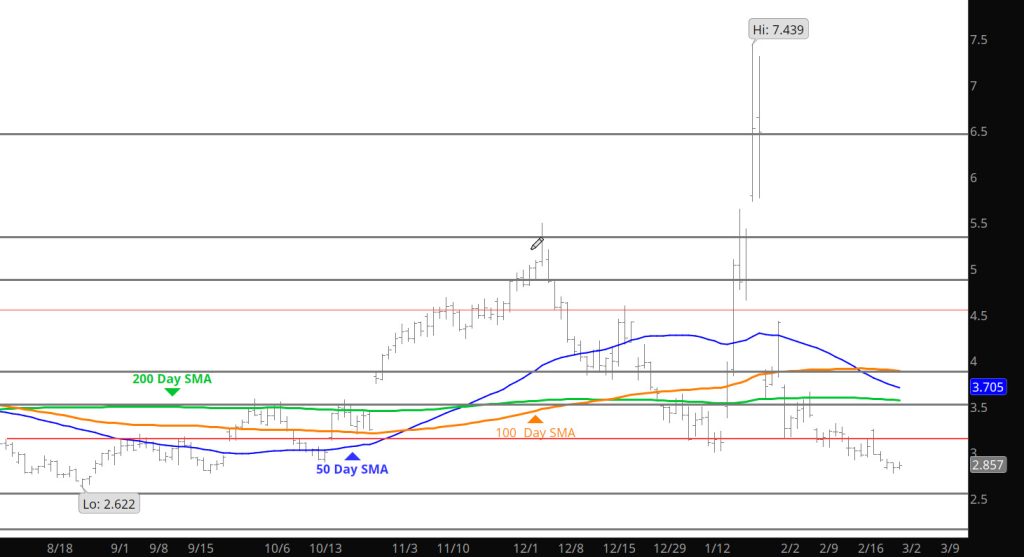
Major Support: $2.87-$2.84, $2.640-$2.57 Minor Support/Resistance : $3.16-$3.148, $3.136 Major Resistance: $3.02, $2.97-$2.93, $3.787-$3.831, $4.063,$4.086, $4.593, $5.333, $5.496
Prices are now off to the start of the April as prompt and starting from the low end of the range established in the last couple of week. No key technical elements to discuss except prices are at the low end of the range- therefore risk in buying prompt is minimal if you keep the stops tight at last months low.
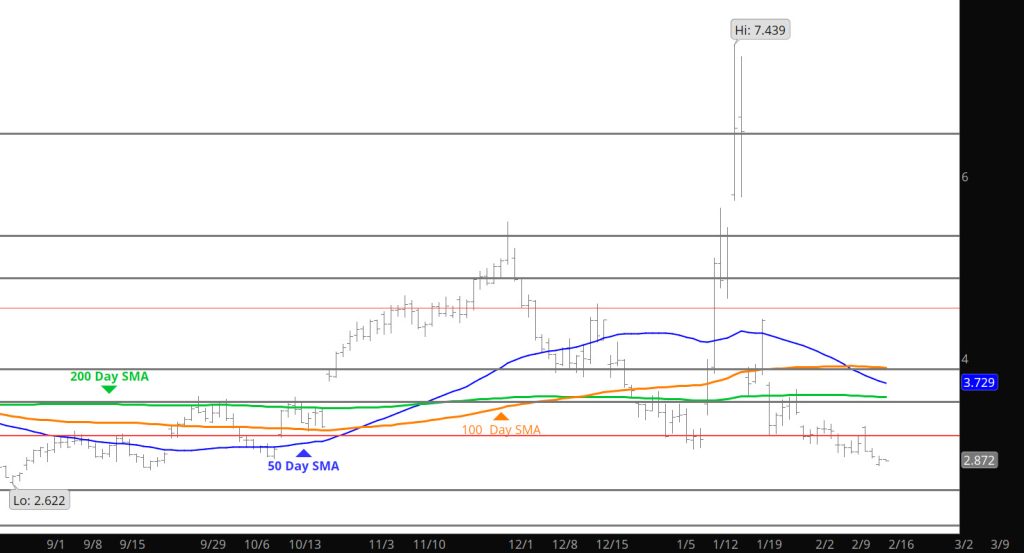
Major Support: $2.87-$2.84, $2.640-$2.57 Minor Support/Resistance : $3.16-$3.148, $3.136 Major Resistance: $3.02, $2.97-$2.93, $3.787-$3.831, $4.063,$4.086, $4.593, $5.333, $5.496
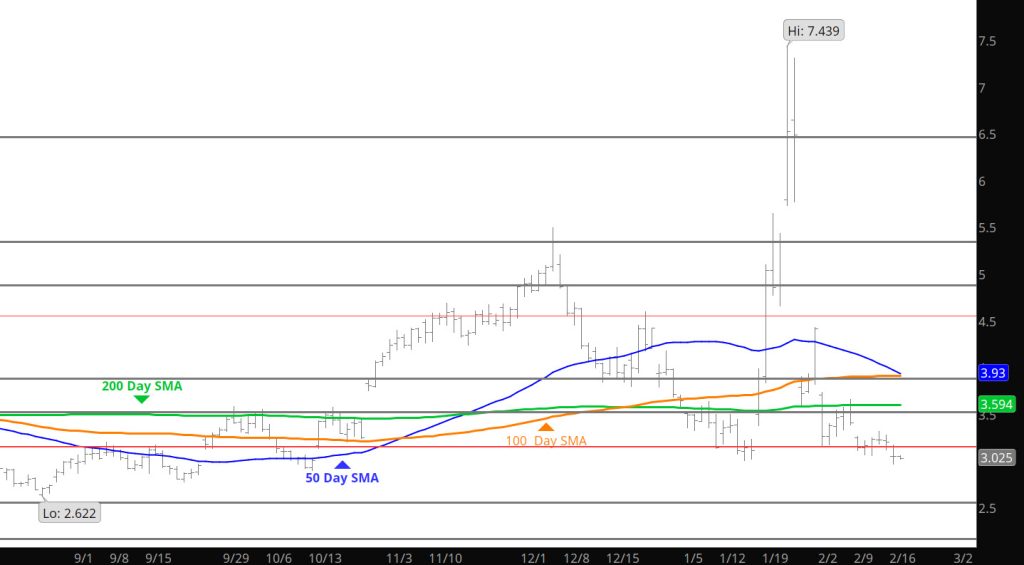
Been talking about gaps lower after the weekend for the last few weeks. This week it turns out to be a gap higher at the time of this writing (likely due to the storm on the East coast). Would not read a lot into this action going into the expiration process but the high side of trading has some well defined resistance from the remaining gaps. The downside has be defined in the last couple of weeks.
Major Support: $3.024, $2.97-$2.93 Minor Support/Resistance : $3.16-$3.148, $3.136 Major Resistance: $3.787-$3.831, $4.063, $4.086, $4.593, $5.333, $5.496
Mentioned earlier in the week the market seemed to be looking for a fundamental justification for a bias break out of the range. I was wrong as yesterday’s bearish storage number could only take prices back to the low support range- but break down further. Want to analyze the week as a whole for any directional bias but I don’t think there will be any massive adjustment to my thinking as we are headed into expiration next week.
Major Support: $3.024, $2.97-$2.93 Minor Support/Resistance : $3.16-$3.148, $3.136 Major Resistance: $3.787-$3.831, $4.063,$4.086, $4.593, $5.333, $5.496
The three day weekend low was confirmed yesterday but not broken as prices found support just above the Monday low. Seems like the range will continue to hold short of a fundamental issue (storage report) that could potentially adjust bias near term.
Major Support: $3.024, $2.97-$2.93 Minor Support/Resistance : $3.16-$3.148, $3.136 Major Resistance: $3.787-$3.831, $4.063,$4.086, $4.593, $5.333, $5.496
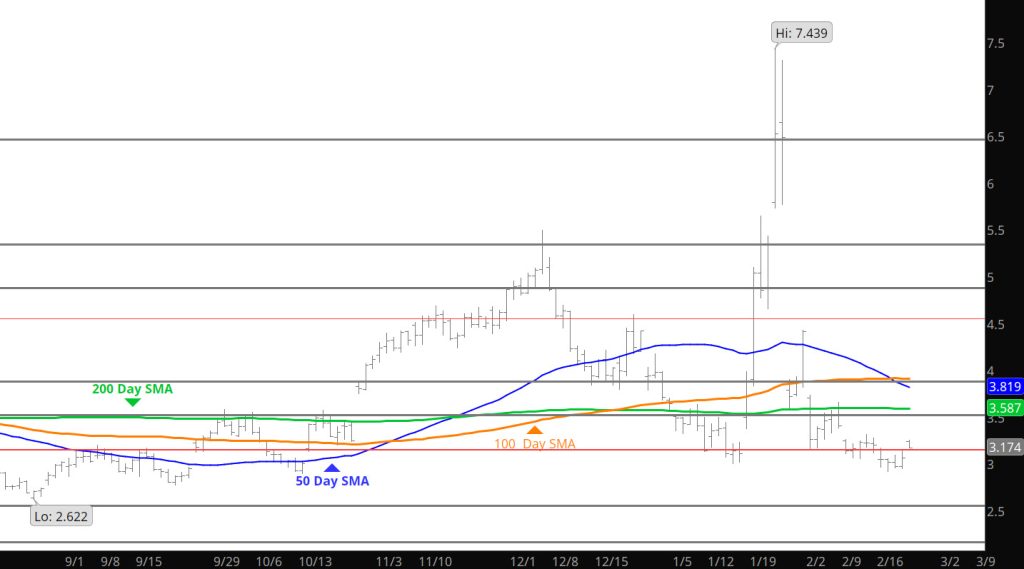
Last week after March rallied from Monday’s high volume low ($3.155) on substantial lower volume. The air left the balloon and prices succumbed to gravity (gravity is the only thing that works every time).
A low volume rally after a high volume decline suggests an absence of enthusiastic buying interest. Typically, the result of the brief run is that price returns from whence it came…and often somewhat lower low. That is exactly what happened during the past week.
March began that process with another gap down…that remains open between $3.316 and $3.387. The prompt traded a lower low on Tuesday and Wednesday. The last two of those lows carrying March into the target zone between $3.025 and $3.100. The important technical news is not that the bounce didn’t last or that March traded a lower low, the more important factors are 1) that the prompt did so with lower volume, 2) that the low before a minor “outside” day reversal higher was above the rising long – term trend defining trend line and, 3) that the low was a higher low (higher than the January low, $3.055 v $3.006). The last technical aspect of trade was corrected with a lower low on light trade Monday.
The consensus of technical indicators continued to deteriorate but resists clear negative agreement, similar from the way the consensus declined positive agreement during the December and January rallies.
The aftereffects of extreme range expansion are still being felt by momentum indicators, but the math is slowly returning to normal. Without regard to the anomalies created a few weeks ago, weekly indicators have a price negative bias with bearish momentum divergences. The daily MACD is similarly oversold to the calculation just preceding the January low. Market internals presented a unified positive bias for the first time in a while. Volume fell along with prompt gas as did open interest which both are technical positives.
Major Support: $3.16-$3.148, $3.136-$3.024, $2.93 Minor Support/Resistance : Major Resistance: $3.387, $3.787-$3.831, $4.063,$4.086, $4.593, $5.333, $5.496
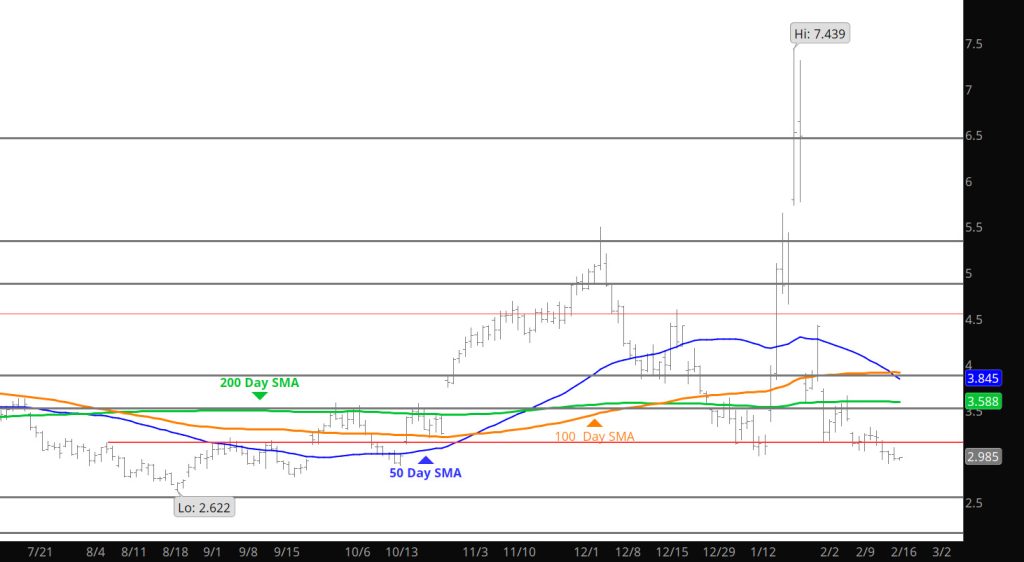
Once again the three day weekend left the market with a gap and price could not fill it by the end of trade Monday. Prices did establish a lower low which from a technical standpoint is interesting but the lack of volume makes me suspect. A new week, winter is starting to wrap up what will pull the markets interest.
Major Support: $3.16-$3.148, $3.136-$3.024, $2.93 Minor Support/Resistance : Major Resistance: $3.38,$3.787-$3.831, $4.063,$4.086, $4.593, $5.333, $5.496