
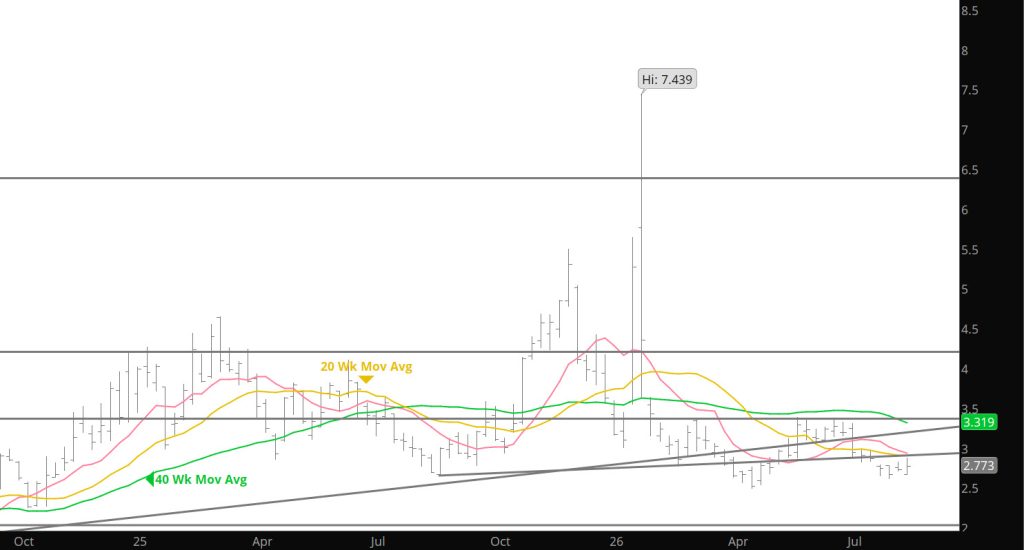
Weekly Continuous
Several subscribers asked to have the Weekly and Daily Calls continue past the end of August. I will continue to post as my travels will allow. The primary reason for my ending the Call is my inability to attain the internet while I travel. So there will be many days when the Daily is unavailable but I will try to publish the Weekly each week through September.
Last week created not quite a textbook doji (no new low or high traded) the low volume test of those lows and immediate recovery seemed to suggest exhaustion…there was simply not enough sellers/volume to push through the already well – defined support. That shortage of new sellers triggered a rally…some rallies are less a function of a wave of buyers than of a shortage of sellers. The rally that extended through last week’s high closed all the continuation gaps, although there is still a sliver of a gap left on the September chart (between $2.875 and $2.877) and a slightly wider one on the October chart between $2.898 and $2.909, before September faded from the well – defined resistance to end its last full week as prompt about a nickel higher than August settlement. While it might be a little picky shows the first higher daily closing low followed by a higher daily closing high in a long time and is just another one more red flag warning. For the week, prompt gas traded an “outside” week reversal higher.
Clients may recall that “outside” week reversals (when prompt gas opens lower, trades through the previous week’s low that reverses to trade through the previous week’s high and ends the week higher have historically been the gas market’s preferred method of communicating that a significant, unsustainable low has traded. The absence of volume, which was less than a week ago, is likely a disqualifying factor. That said, a year ago during the week beginning 08/25…the week that the 2025 annual low traded, prompt gas also traded an “outside” week reversal with less than impressive volume.
“Outside” week reversals are relatively rare chart patterns…and usually carry some significance into coming weeks, but an “outside” week with a range of only $.237 is even rarer and was only “outside” because last week’s range was $.140 (counting the opening gap). Further, essentially the “outside” week’s range just retraced the ranges of the last four weeks and the close was lower than the first of those ($2.773 v $2.792) but was the highest weekly close of September’s tenure as prompt ($1.747, $2.662, $2.733 and $2.773). That’s what range bound trade looks like.
Notwithstanding the less than remarkable “outside” week reversal, there are warning flags flying in the gas market…and they are flying at a time of year that has in recent years marked the low ebb of the price negative Q3 seasonal. This week’s unremarkable reversal is just the latest one.
The consensus of technical indicators, which remained neutral (with a fluctuating bias) for the entire second calendar quarter, is negative for a sixth week…but having improved two weeks running, is just so. A higher close next week will likely result in an upgrade.
The weekly MACD, our primary “lagging” indicator is negative for a seventh week. The daily MACD turned up a little last week to the positive side of neutral, is now positive. The weekly RSI is positive for a second week. The very sensitive daily RSI is positive after a bullish momentum divergence two weeks ago.
Market internals, which improved in both of the last two weeks are now neutral. Volume fell as prompt gas rallied while open interest increased 20,800+ after falling 15,500+ last week. Since 06/25 with price falling from the Q2 high the total number of contracts outstanding has increased from 1,610,728 to 1,734,658. My guess is that the +/- 125,000 increase creates a whole bunch of vulnerable short positions Prompt gas remains below all important moving averages. The total range traded this week was $.237, the last three weeks $.140, $.216 and $.194. As previously said, red flags are being waved by the absence of volatility.
As previously discussed, full maturity of the annual cycle is upon us During the last week or so of September’s tenure as prompt. The short – intermediate term cycle measured from the April low is also fully mature. Maturity of the cycle from the June Q2 high will occur between mid – September and October expiration. Guesses are that the Q3 low cycle is forming and will likely continue through the Labor Day holiday.
Major Support: $2.676, $2.640-$2.57
Minor Support/Resistance : $2.87-$2.84, $3.16-$3.148, $3.136, $3.02-$2.97
Major Resistance: $3.35, $3.486-$3.494, $3.567, $ 3.736