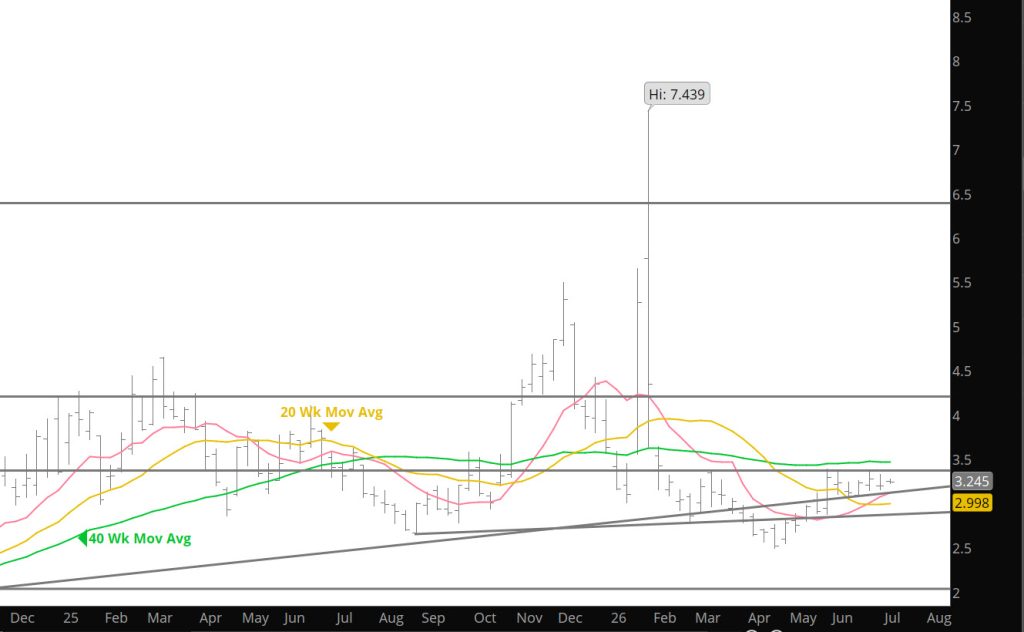
Prompt gas and the August contract remain confined in an increasingly well – defined trading range between $3.000 – $3.050 and $3.375 – $3.440. Friday’s last trade, $3.245 was just about exactly in the middle of that range, Thursday’s close, $3.196 just south of the middle. Recently discuss the seasonal tendency bracketing Independence Day . Currently, prompt gas has declined .290 from the 06/26 pre -holiday high ($3.441 – $3.151) or about 8.5%. While that percentage decline is greater than the declines in ’19 or ’21 it is well short of the three, five and ten years averages (15.3%, 18.9% and 21.6%, respectively). Typically, August gas continues to feel the seasonal pressure when trading resumes before a post – holiday low most often traded between the 10th and the 20th.
The consensus of technical indicators remains neutral, as it did for the entire second calendar quarter. A close above the 40 – weeks SMA and the March/June highs with supporting volume would trigger positive agreement of the indicators. A close below well – defined support between +/- $3.00 and $3.05 would, at a minimum, introduce a strong price negative bias. The weekly MACD, my primary “lagging” indicator, remained positive. The daily MACD, the weekly and daily RSI are all neutral. Given that since May 28th prompt gas has been confined in daily closing range between $3.087 and $3.343, the neutral configuration of sensitive mathematical indicators makes sense. Market internals are also neutral with the suggestion of a price negative bias. Average daily volume fell by more than 20,000 contracts as prompt August traded in narrow range. Open interest increased 43,000+ contracts…which suggests that commercial hedging may be coming in at a lower price level. The total range traded this week was .177, leaving the weekly ATR at .260…that is more than a nickel lower than the August ’25 low…getting closer to a red flag zone. The daily ATR fell to .135. The violated trend line from the ’24 – ’25 lows should be expected to present resistance…as it has for the last couple of months. The value of the trend line for calendar July is $3.360.
To read The Daily Call you must be a subscriber (Current members sign in here. )