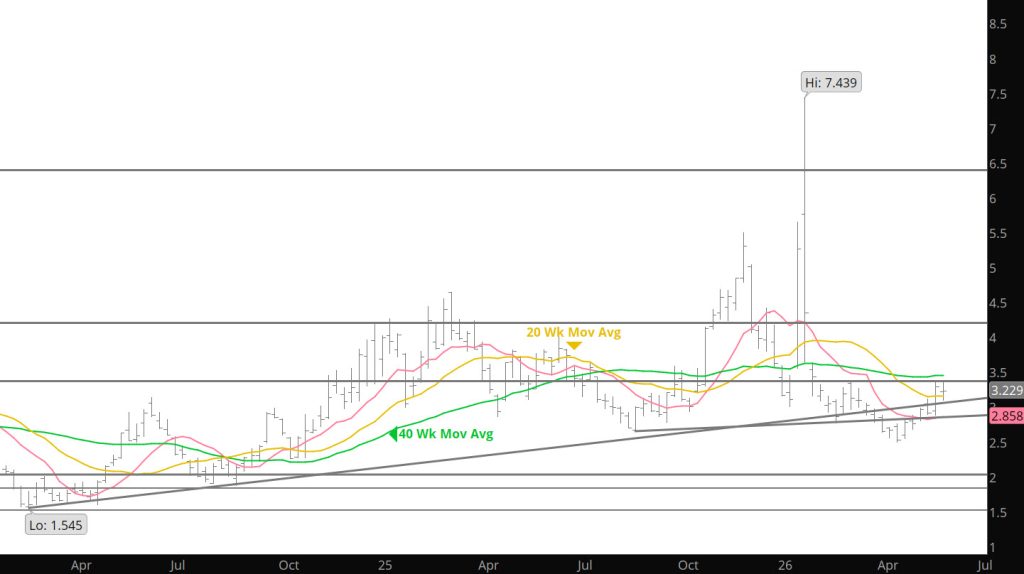
Weekly Continuous
Trading last week performed a slightly higher high, $3.396 v $3.388 but again without apparent volume support, July then reversed lower a second time. By mid – day Tuesday July was challenging support (the target zone in support was $3.050 –$3.100,). July traded just into that zone, the low for the week was $3.099. It did so with the lowest volume in nearly a month (the volume requirement works the same way in both directions). Diminishing volume as resistance and then support is tested is characteristic of rangebound trade…unless the gas market can generate more conviction one way or the other, a reasonable guess is that’s what we’ll see for most of June.
Violation of that less than substantial support is likely to lead to a test of the more significant trend line rising from the April/May lows (currently $3.00) and rising a little less than .02/day) providing an opportunity for a low chance to institute for July before another test of the 40 – weeks.
While it has happened before (notably in ’20 when the gas market was in a pronounced downtrend), the first trading day of June is a historically unlikely date for the June high. As previously discussed, over the years the July contract has been more likely to trade its high as prompt either side of 06/15 and in a few cases has been well – bid into contract expiration.
A year ago, prompt gas also traded a March high and an April low, rallied to a pre – Memorial Day high then faded to an 05/29 low (this year that low was 05/27). July ’25 remained range-bound until breaking out on 06/17 and extending its rally to a high on 06/20 ($4.148) before collapsing from the Q2 ’25 high into expiration ($3.261). While a repeat of that collapse should not be totally discounted, this year’s uptrend from the April low is far more orderly than ’25…continue to expect that July settlement will be higher than June ($3.040).
The consensus of technical indicators has now been neutral for fourteen of the last fifteen weeks…this week forfeiting the price positive bias that was earned a week ago. That’s pretty typical for the consensus during the construction of a trading range. A close above the 40 – weeks SMA with supporting volume would trigger positive agreement of the indicators.
Market internals have been mixed for three straight weeks. Average daily volume was lower even though July managed a higher high before falling…higher volume should accompany higher prices if a rally is sustainable. It didn’t and the rally wasn’t.
Major Support: $2.640-$2.57
Minor Support/Resistance : $2.87-$2.84, $3.16-$3.148, $3.136, $3.02-$2.97
Major Resistance: $3.35, $3.486-$3.494, $3.567, $ 3.736