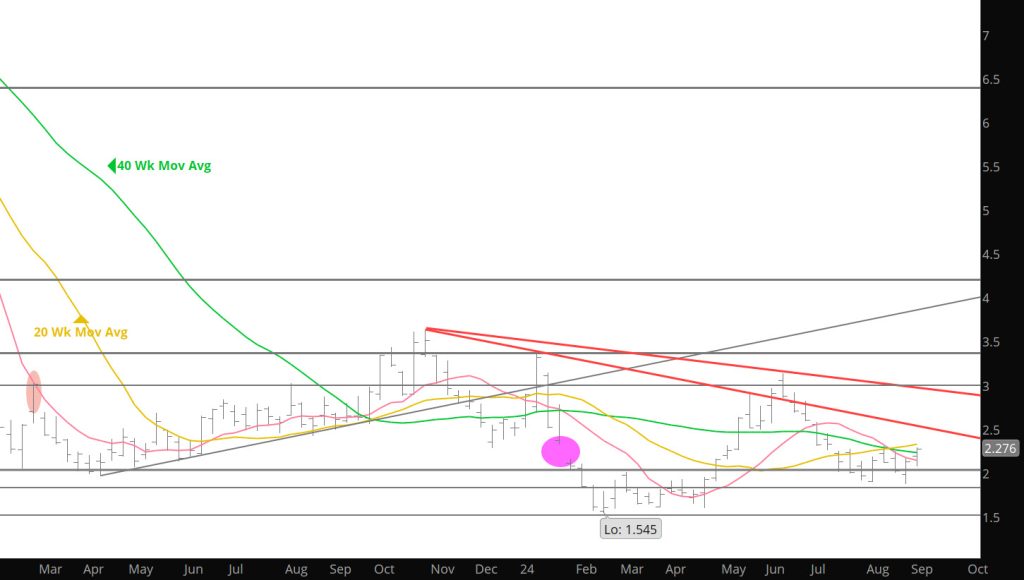
Weekly Continuous
Twice during the holiday shortened week expected post – Labor Day seasonal pressure appeared to begin to weigh on the prompt, both times (Tuesday and Thursday) October traded an “outside” day reversal higher with increasing volume. This suggests that weakness was being aggressively bought. Before the end of the trading week October was testing the calendar August high ($2.301). That high along with a late July high ($2.270) defined the upper boundary of a daily trading range that has confined successive prompts since mid – July and testing its own 50 – day SMA (currently $2.298 and falling). The close was $.148 above October’s pre – holiday close and less that $.02 below the week’s high the highest weekly close since 07/12 (the fifth of eight down weeks following the June Q2).
As previously discussed, prompt gas has traditionally felt seasonal pressure following the holiday but there is no special magic about the next few days after Labor Day. While sellers are usually in control, price strength has occasionally suggested that the late summer price negative seasonal tendency has already been satisfied.
With that said, while they are not all that common there have been a few years when prompt gas rallied through Labor Day only to trade a mid – month high and then forfeit those “counter seasonal” gains. ’19 and ’21 are the most recent examples. In the former prompt October rallied hard after trading through the August high…peaked at 2.700 on 9/17 then declined through expiration. In ’21 the rally high was on 09/15 at 5.650. Over the next five days the prompt gave up nearly a dollar before finding support.
Mentioned for the last few weeks three challenges for the gas market have been discussed. One of those challenges is unique to the downtrend from the January high and the construction of both the Q1/Q2 and Q3 trading ranges; the other two are long – term historically consistent seasonal’s. Two of the three have been satisfied with the average/above average declines from the Q2 high and then from a mid/late August high. The leaves only the tendency of expiring contracts to decline as their tenures as prompt near an end. As written here multiple times, failure of an expiring contract to be “amply offered” into expiration will be an indication that the character of the gas market is changing/has changed and will be a strong signal that higher prices are on the way. IF the traditional rally toward a Q4/Q1 high began with September’s expiration decline to test the July low, October will pass that test. Keep that thought in the back of your mind over the coming weeks.
The consensus of technical indicators improved a little last week and built on that improvement during the previous week. Support from improving market internals (volume and open interest), daily and weekly closes over several moving averages along with the daily closing momentum divergence mentioned last week (the daily RSI, a VERY sensitive “leading” indicator that never confirmed the July expiration lower low) left the consensus neutral for the first time since indicator deterioration began before the early June Q2 high .
Major Support:, $2.112, $2.026-2.00, $1.991, $1.93 ,$1.642, $1.605
Minor Support : $1.856,$1.89-$1.856
Major Resistance:$2.18, $2.25-$2.310, $2.39, $2.44-$$2.502, $2.618, $3.00, $3.16