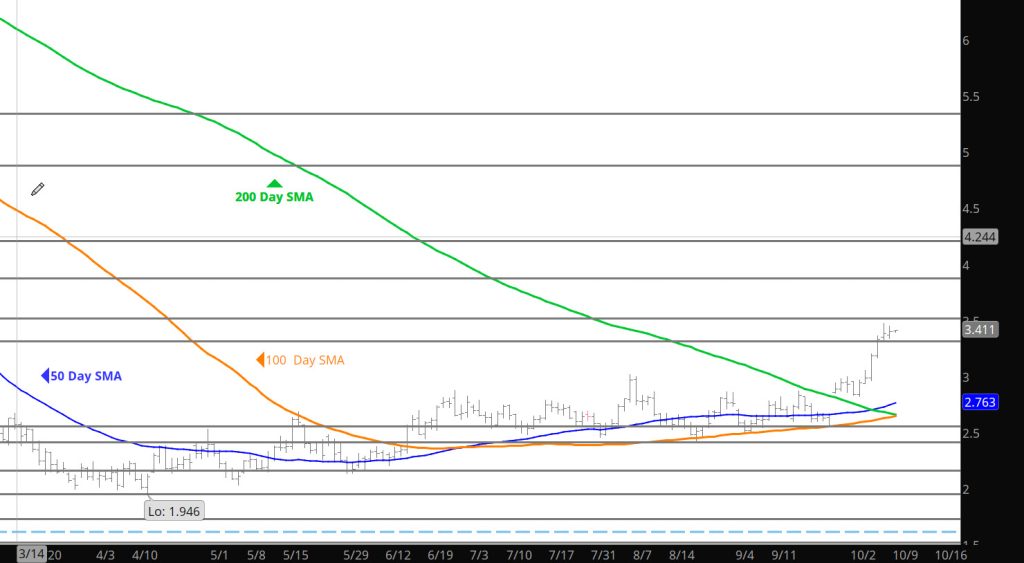
Daily Continuous
Prices remained calm through the digestion process and nothing seems to stick out from a technical perspective on the Continuous chart above. That said the Spot Nov charts sheds some additional light on why the pause at $3.47-$3.48 area. Look at the spot November chart below below, the area was the high from trade in August on that brief test of resistance while Sept was prompt.
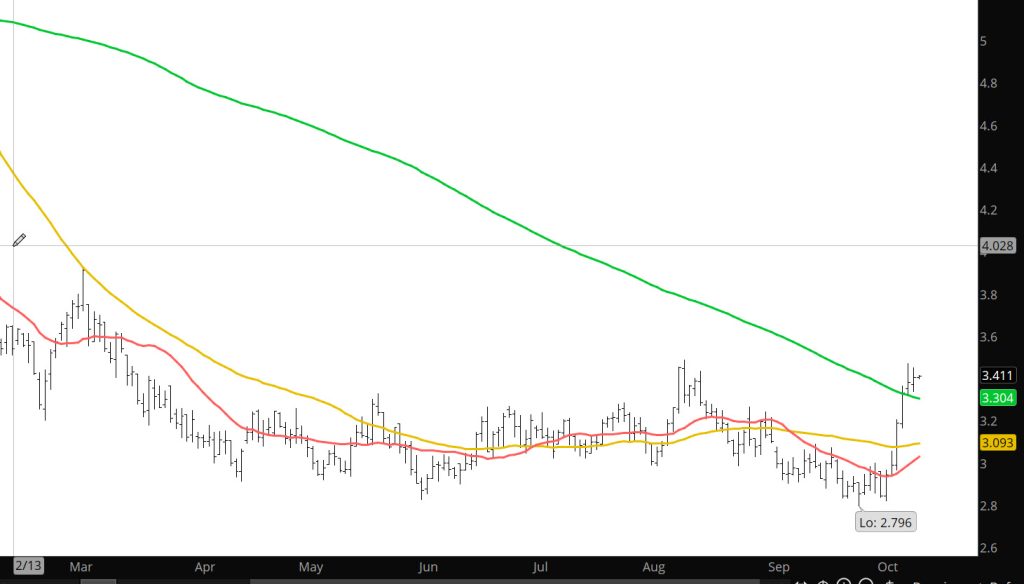
Spot November Contract
From this area there is little resistance in the spot chart until the early March highs.
Major Support: $2.608, $2.47, $2.00, $1.991-$1.96, $1.795-$1.766
Minor Support $3.04-$3.028, $2.84, $2.38-$2.26, $2.17
Major Resistance $3.42-$3.48, $3.536, 3.59