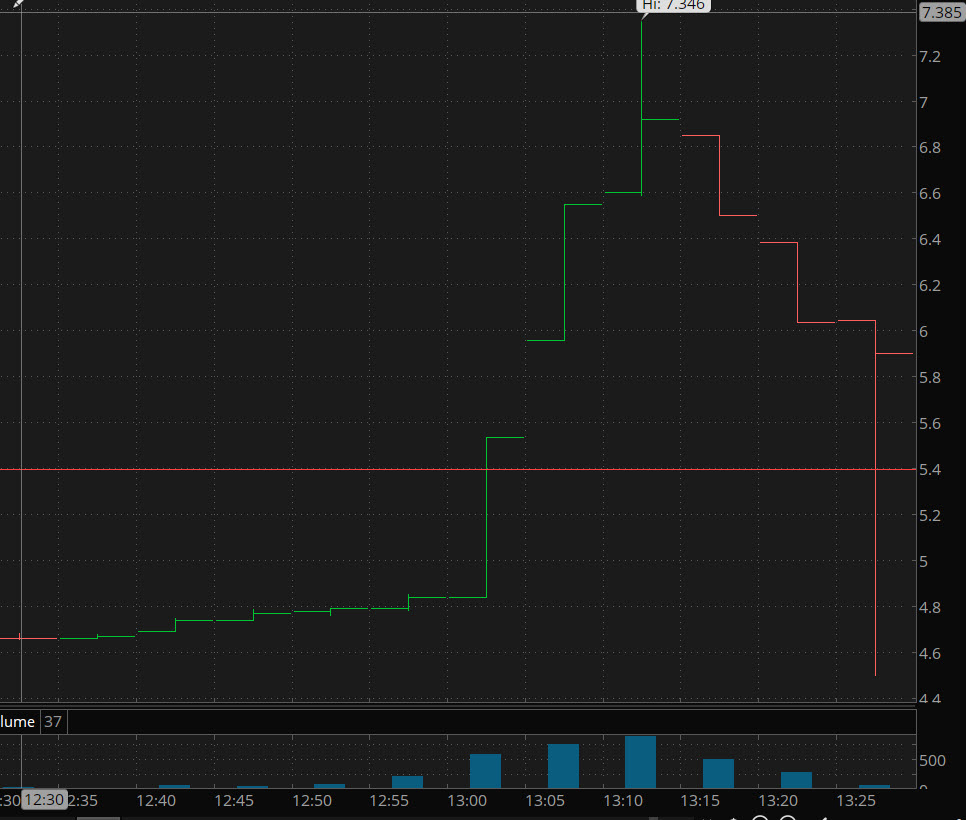
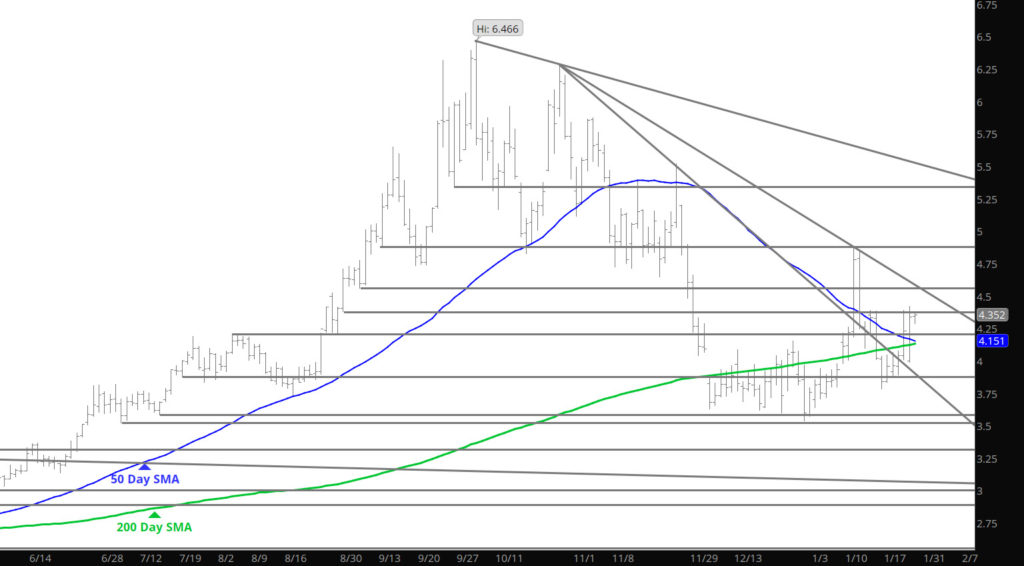
Now that is a “wood shed” moment- The chart above clearly shows what happens when volume is light at expiration and some folks have to cover. The High of $7.346 is unbelievable and well above my closing range high for Feb gas in the Weekly section — That said, prices did return for a few trades with in the range. What is more important is the Daily chart below for March gas that takes over as prompt tomorrow. In the Daily chart below, notice it did not enjoy the same short cover squeeze that prompt Feb endured, rather staying well within the defined range.
Daily Continuous
Take a day or two to let the “froth” in the market to clear define it’s intention by consolidating in a new or similar range. Guess it is cold back East, buy gas now. Let this digest.